Laotian vs Immigrants from Jamaica Median Female Earnings
COMPARE
Laotian
Immigrants from Jamaica
Median Female Earnings
Median Female Earnings Comparison
Laotians
Immigrants from Jamaica
$42,133
MEDIAN FEMALE EARNINGS
99.4/ 100
METRIC RATING
85th/ 347
METRIC RANK
$38,625
MEDIAN FEMALE EARNINGS
9.7/ 100
METRIC RATING
217th/ 347
METRIC RANK
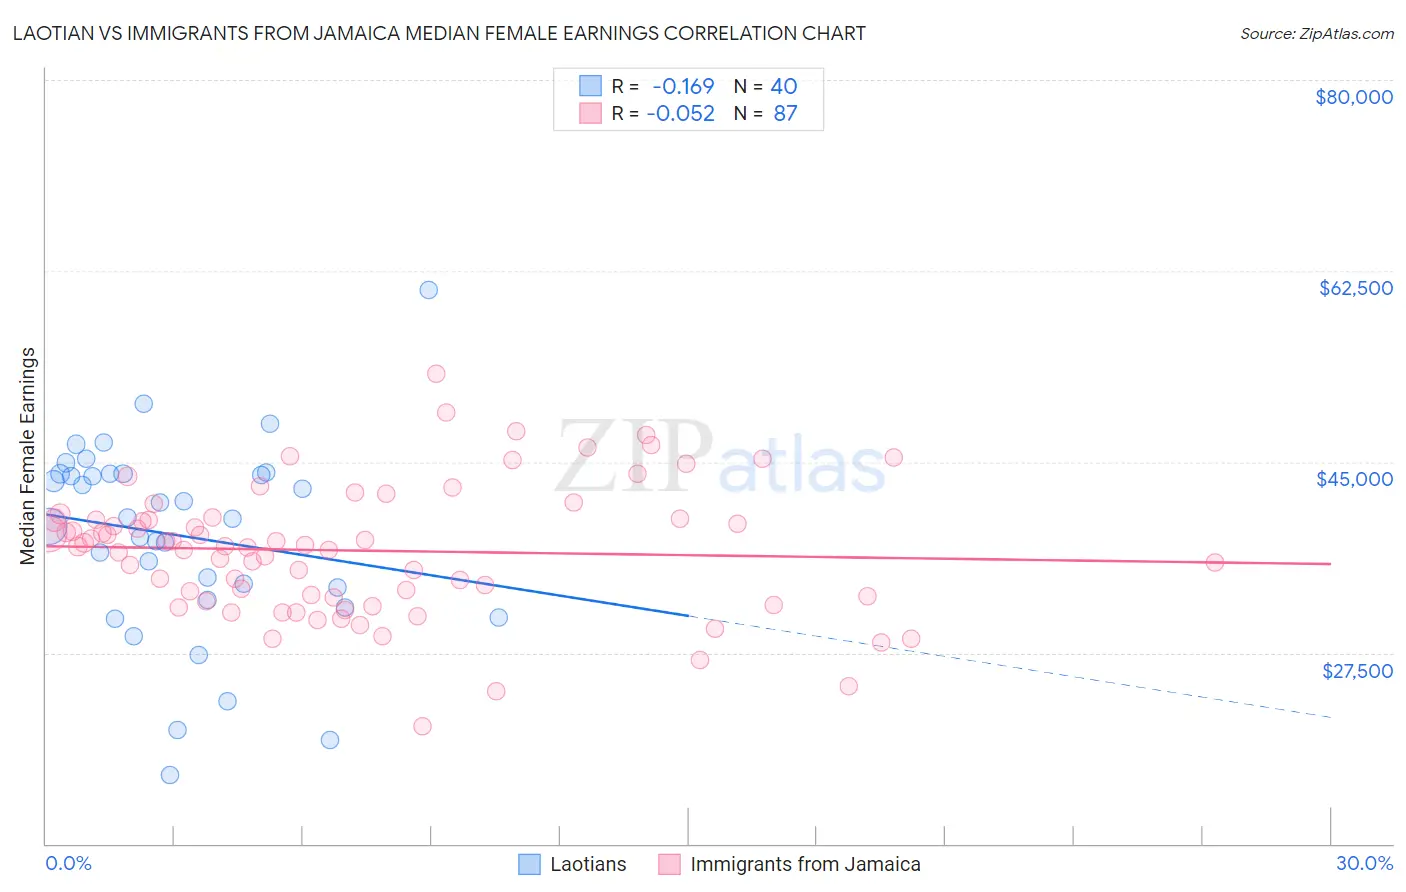
Laotian vs Immigrants from Jamaica Median Female Earnings Correlation Chart
The statistical analysis conducted on geographies consisting of 224,815,855 people shows a poor negative correlation between the proportion of Laotians and median female earnings in the United States with a correlation coefficient (R) of -0.169 and weighted average of $42,133. Similarly, the statistical analysis conducted on geographies consisting of 301,720,032 people shows a slight negative correlation between the proportion of Immigrants from Jamaica and median female earnings in the United States with a correlation coefficient (R) of -0.052 and weighted average of $38,625, a difference of 9.1%.
Median Female Earnings Correlation Summary
| Measurement | Laotian | Immigrants from Jamaica |
| Minimum | $16,291 | $20,815 |
| Maximum | $60,722 | $53,086 |
| Range | $44,431 | $32,271 |
| Mean | $38,224 | $36,867 |
| Median | $39,876 | $37,264 |
| Interquartile 25% (IQ1) | $32,877 | $32,574 |
| Interquartile 75% (IQ3) | $43,879 | $39,745 |
| Interquartile Range (IQR) | $11,002 | $7,171 |
| Standard Deviation (Sample) | $8,986 | $5,965 |
| Standard Deviation (Population) | $8,873 | $5,931 |
Similar Demographics by Median Female Earnings
Demographics Similar to Laotians by Median Female Earnings
In terms of median female earnings, the demographic groups most similar to Laotians are Immigrants from St. Vincent and the Grenadines ($42,108, a difference of 0.060%), Lithuanian ($42,108, a difference of 0.060%), Immigrants from Northern Africa ($42,084, a difference of 0.12%), Immigrants from Afghanistan ($42,055, a difference of 0.18%), and Immigrants from Sierra Leone ($42,214, a difference of 0.19%).
| Demographics | Rating | Rank | Median Female Earnings |
| Immigrants | Kazakhstan | 99.6 /100 | #78 | Exceptional $42,386 |
| Greeks | 99.6 /100 | #79 | Exceptional $42,336 |
| Immigrants | Moldova | 99.6 /100 | #80 | Exceptional $42,304 |
| Immigrants | Southern Europe | 99.5 /100 | #81 | Exceptional $42,275 |
| Immigrants | Morocco | 99.5 /100 | #82 | Exceptional $42,229 |
| Immigrants | Sierra Leone | 99.5 /100 | #83 | Exceptional $42,214 |
| Armenians | 99.5 /100 | #84 | Exceptional $42,212 |
| Laotians | 99.4 /100 | #85 | Exceptional $42,133 |
| Immigrants | St. Vincent and the Grenadines | 99.3 /100 | #86 | Exceptional $42,108 |
| Lithuanians | 99.3 /100 | #87 | Exceptional $42,108 |
| Immigrants | Northern Africa | 99.3 /100 | #88 | Exceptional $42,084 |
| Immigrants | Afghanistan | 99.3 /100 | #89 | Exceptional $42,055 |
| Ukrainians | 99.2 /100 | #90 | Exceptional $42,015 |
| Immigrants | Western Europe | 99.2 /100 | #91 | Exceptional $41,990 |
| Argentineans | 99.1 /100 | #92 | Exceptional $41,952 |
Demographics Similar to Immigrants from Jamaica by Median Female Earnings
In terms of median female earnings, the demographic groups most similar to Immigrants from Jamaica are Cape Verdean ($38,614, a difference of 0.030%), Immigrants from Ecuador ($38,644, a difference of 0.050%), Nepalese ($38,603, a difference of 0.060%), Spaniard ($38,656, a difference of 0.080%), and Iraqi ($38,666, a difference of 0.11%).
| Demographics | Rating | Rank | Median Female Earnings |
| Czechoslovakians | 12.0 /100 | #210 | Poor $38,738 |
| Aleuts | 11.6 /100 | #211 | Poor $38,719 |
| Guamanians/Chamorros | 11.5 /100 | #212 | Poor $38,717 |
| Jamaicans | 10.5 /100 | #213 | Poor $38,670 |
| Iraqis | 10.5 /100 | #214 | Poor $38,666 |
| Spaniards | 10.3 /100 | #215 | Poor $38,656 |
| Immigrants | Ecuador | 10.1 /100 | #216 | Poor $38,644 |
| Immigrants | Jamaica | 9.7 /100 | #217 | Tragic $38,625 |
| Cape Verdeans | 9.5 /100 | #218 | Tragic $38,614 |
| Nepalese | 9.3 /100 | #219 | Tragic $38,603 |
| Yugoslavians | 8.8 /100 | #220 | Tragic $38,573 |
| Immigrants | Azores | 8.8 /100 | #221 | Tragic $38,573 |
| Japanese | 8.1 /100 | #222 | Tragic $38,528 |
| Immigrants | Sudan | 7.8 /100 | #223 | Tragic $38,511 |
| Native Hawaiians | 7.1 /100 | #224 | Tragic $38,461 |