Korean vs Immigrants from Belgium Per Capita Income
COMPARE
Korean
Immigrants from Belgium
Per Capita Income
Per Capita Income Comparison
Koreans
Immigrants from Belgium
$44,522
PER CAPITA INCOME
72.5/ 100
METRIC RATING
149th/ 347
METRIC RANK
$55,082
PER CAPITA INCOME
100.0/ 100
METRIC RATING
14th/ 347
METRIC RANK
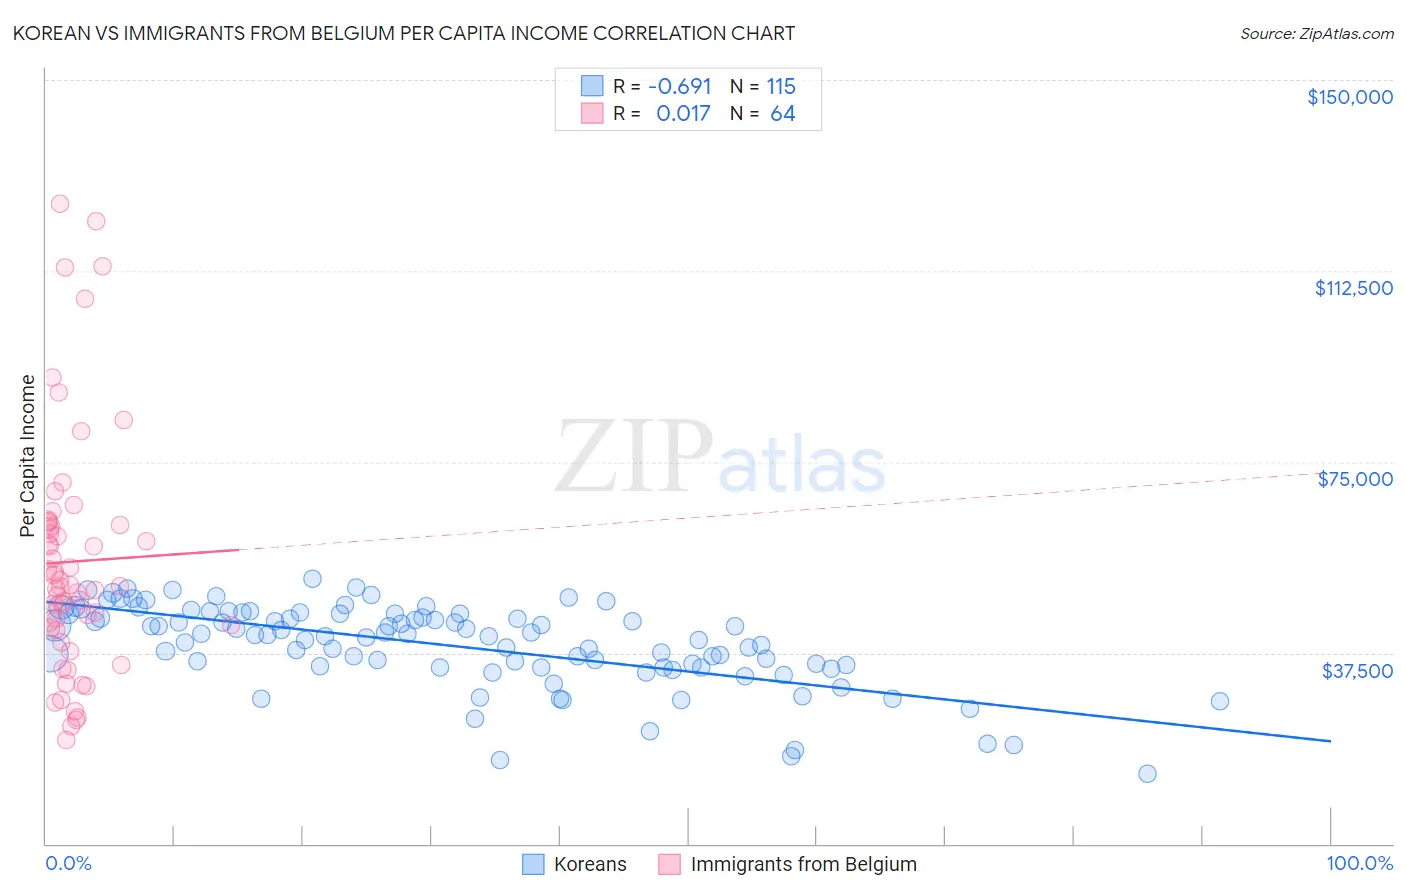
Korean vs Immigrants from Belgium Per Capita Income Correlation Chart
The statistical analysis conducted on geographies consisting of 510,996,517 people shows a significant negative correlation between the proportion of Koreans and per capita income in the United States with a correlation coefficient (R) of -0.691 and weighted average of $44,522. Similarly, the statistical analysis conducted on geographies consisting of 146,715,223 people shows no correlation between the proportion of Immigrants from Belgium and per capita income in the United States with a correlation coefficient (R) of 0.017 and weighted average of $55,082, a difference of 23.7%.
Per Capita Income Correlation Summary
| Measurement | Korean | Immigrants from Belgium |
| Minimum | $13,802 | $20,313 |
| Maximum | $52,147 | $125,796 |
| Range | $38,345 | $105,483 |
| Mean | $38,981 | $55,426 |
| Median | $40,908 | $50,708 |
| Interquartile 25% (IQ1) | $34,687 | $42,261 |
| Interquartile 75% (IQ3) | $45,181 | $62,896 |
| Interquartile Range (IQR) | $10,494 | $20,635 |
| Standard Deviation (Sample) | $8,123 | $23,673 |
| Standard Deviation (Population) | $8,088 | $23,487 |
Similar Demographics by Per Capita Income
Demographics Similar to Koreans by Per Capita Income
In terms of per capita income, the demographic groups most similar to Koreans are Immigrants from Eritrea ($44,509, a difference of 0.030%), Immigrants from Armenia ($44,552, a difference of 0.070%), Norwegian ($44,480, a difference of 0.10%), Peruvian ($44,479, a difference of 0.10%), and Czech ($44,595, a difference of 0.16%).
| Demographics | Rating | Rank | Per Capita Income |
| Ugandans | 82.6 /100 | #142 | Excellent $45,047 |
| Immigrants | Uganda | 82.5 /100 | #143 | Excellent $45,043 |
| Icelanders | 81.6 /100 | #144 | Excellent $44,987 |
| Immigrants | Afghanistan | 78.0 /100 | #145 | Good $44,790 |
| Irish | 75.8 /100 | #146 | Good $44,679 |
| Czechs | 74.1 /100 | #147 | Good $44,595 |
| Immigrants | Armenia | 73.1 /100 | #148 | Good $44,552 |
| Koreans | 72.5 /100 | #149 | Good $44,522 |
| Immigrants | Eritrea | 72.1 /100 | #150 | Good $44,509 |
| Norwegians | 71.5 /100 | #151 | Good $44,480 |
| Peruvians | 71.5 /100 | #152 | Good $44,479 |
| Scottish | 70.6 /100 | #153 | Good $44,440 |
| Portuguese | 68.7 /100 | #154 | Good $44,362 |
| Uruguayans | 67.6 /100 | #155 | Good $44,318 |
| Slovaks | 65.4 /100 | #156 | Good $44,229 |
Demographics Similar to Immigrants from Belgium by Per Capita Income
In terms of per capita income, the demographic groups most similar to Immigrants from Belgium are Cypriot ($54,899, a difference of 0.33%), Immigrants from India ($55,268, a difference of 0.34%), Immigrants from Switzerland ($54,866, a difference of 0.39%), Immigrants from Sweden ($55,582, a difference of 0.91%), and Immigrants from France ($54,557, a difference of 0.96%).
| Demographics | Rating | Rank | Per Capita Income |
| Immigrants | Israel | 100.0 /100 | #7 | Exceptional $57,384 |
| Immigrants | Hong Kong | 100.0 /100 | #8 | Exceptional $56,709 |
| Immigrants | Ireland | 100.0 /100 | #9 | Exceptional $56,584 |
| Okinawans | 100.0 /100 | #10 | Exceptional $55,817 |
| Eastern Europeans | 100.0 /100 | #11 | Exceptional $55,780 |
| Immigrants | Sweden | 100.0 /100 | #12 | Exceptional $55,582 |
| Immigrants | India | 100.0 /100 | #13 | Exceptional $55,268 |
| Immigrants | Belgium | 100.0 /100 | #14 | Exceptional $55,082 |
| Cypriots | 100.0 /100 | #15 | Exceptional $54,899 |
| Immigrants | Switzerland | 100.0 /100 | #16 | Exceptional $54,866 |
| Immigrants | France | 100.0 /100 | #17 | Exceptional $54,557 |
| Thais | 100.0 /100 | #18 | Exceptional $54,307 |
| Immigrants | China | 100.0 /100 | #19 | Exceptional $54,264 |
| Soviet Union | 100.0 /100 | #20 | Exceptional $54,202 |
| Immigrants | Northern Europe | 100.0 /100 | #21 | Exceptional $54,159 |