Immigrants from Switzerland vs Immigrants from Belgium Divorced or Separated
COMPARE
Immigrants from Switzerland
Immigrants from Belgium
Divorced or Separated
Divorced or Separated Comparison
Immigrants from Switzerland
Immigrants from Belgium
11.5%
DIVORCED OR SEPARATED
99.4/ 100
METRIC RATING
80th/ 347
METRIC RANK
11.5%
DIVORCED OR SEPARATED
99.7/ 100
METRIC RATING
69th/ 347
METRIC RANK
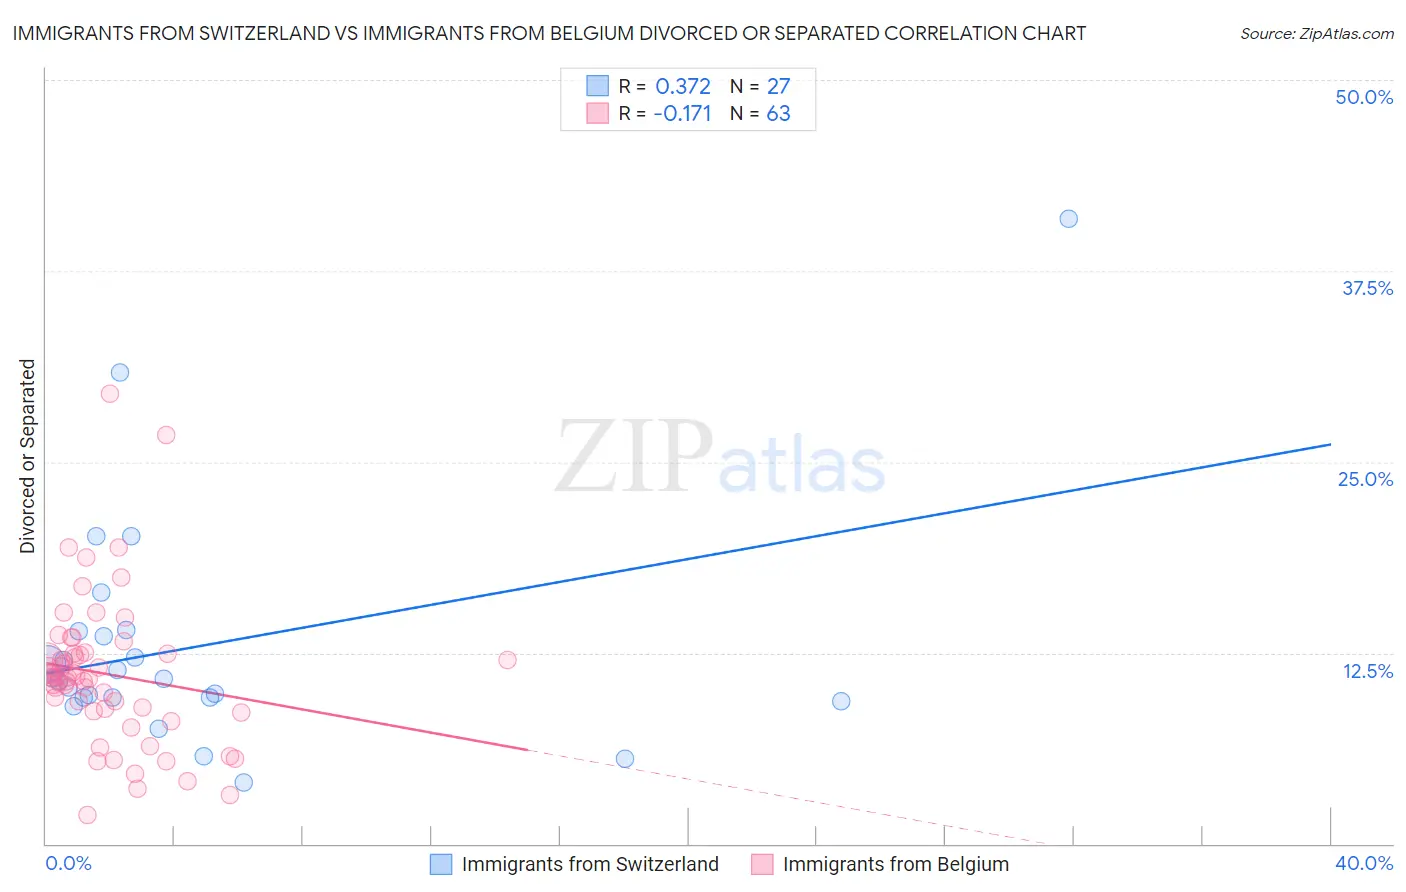
Immigrants from Switzerland vs Immigrants from Belgium Divorced or Separated Correlation Chart
The statistical analysis conducted on geographies consisting of 148,058,792 people shows a mild positive correlation between the proportion of Immigrants from Switzerland and percentage of population currently divorced or separated in the United States with a correlation coefficient (R) of 0.372 and weighted average of 11.5%. Similarly, the statistical analysis conducted on geographies consisting of 146,701,736 people shows a poor negative correlation between the proportion of Immigrants from Belgium and percentage of population currently divorced or separated in the United States with a correlation coefficient (R) of -0.171 and weighted average of 11.5%, a difference of 0.61%.
Divorced or Separated Correlation Summary
| Measurement | Immigrants from Switzerland | Immigrants from Belgium |
| Minimum | 4.0% | 1.9% |
| Maximum | 40.9% | 29.5% |
| Range | 36.9% | 27.6% |
| Mean | 12.9% | 11.1% |
| Median | 10.8% | 10.9% |
| Interquartile 25% (IQ1) | 9.6% | 8.6% |
| Interquartile 75% (IQ3) | 13.9% | 12.5% |
| Interquartile Range (IQR) | 4.3% | 3.8% |
| Standard Deviation (Sample) | 7.7% | 4.9% |
| Standard Deviation (Population) | 7.6% | 4.9% |
Demographics Similar to Immigrants from Switzerland and Immigrants from Belgium by Divorced or Separated
In terms of divorced or separated, the demographic groups most similar to Immigrants from Switzerland are Russian (11.5%, a difference of 0.010%), Guyanese (11.5%, a difference of 0.020%), Afghan (11.5%, a difference of 0.060%), Immigrants from Romania (11.5%, a difference of 0.090%), and Immigrants from Bulgaria (11.5%, a difference of 0.12%). Similarly, the demographic groups most similar to Immigrants from Belgium are Palestinian (11.5%, a difference of 0.0%), Immigrants from Eastern Europe (11.5%, a difference of 0.010%), Immigrants from Syria (11.4%, a difference of 0.11%), Paraguayan (11.5%, a difference of 0.11%), and Jordanian (11.5%, a difference of 0.17%).
| Demographics | Rating | Rank | Divorced or Separated |
| Macedonians | 99.8 /100 | #64 | Exceptional 11.4% |
| Immigrants | South Eastern Asia | 99.8 /100 | #65 | Exceptional 11.4% |
| Inupiat | 99.8 /100 | #66 | Exceptional 11.4% |
| Immigrants | Syria | 99.7 /100 | #67 | Exceptional 11.4% |
| Palestinians | 99.7 /100 | #68 | Exceptional 11.5% |
| Immigrants | Belgium | 99.7 /100 | #69 | Exceptional 11.5% |
| Immigrants | Eastern Europe | 99.7 /100 | #70 | Exceptional 11.5% |
| Paraguayans | 99.7 /100 | #71 | Exceptional 11.5% |
| Jordanians | 99.6 /100 | #72 | Exceptional 11.5% |
| Immigrants | North Macedonia | 99.6 /100 | #73 | Exceptional 11.5% |
| Taiwanese | 99.6 /100 | #74 | Exceptional 11.5% |
| Immigrants | Northern Africa | 99.6 /100 | #75 | Exceptional 11.5% |
| Albanians | 99.6 /100 | #76 | Exceptional 11.5% |
| Immigrants | Italy | 99.5 /100 | #77 | Exceptional 11.5% |
| Afghans | 99.4 /100 | #78 | Exceptional 11.5% |
| Guyanese | 99.4 /100 | #79 | Exceptional 11.5% |
| Immigrants | Switzerland | 99.4 /100 | #80 | Exceptional 11.5% |
| Russians | 99.4 /100 | #81 | Exceptional 11.5% |
| Immigrants | Romania | 99.3 /100 | #82 | Exceptional 11.5% |
| Immigrants | Bulgaria | 99.3 /100 | #83 | Exceptional 11.5% |
| Bulgarians | 99.3 /100 | #84 | Exceptional 11.5% |