Navajo vs Immigrants from Belgium Divorced or Separated
COMPARE
Navajo
Immigrants from Belgium
Divorced or Separated
Divorced or Separated Comparison
Navajo
Immigrants from Belgium
12.0%
DIVORCED OR SEPARATED
63.9/ 100
METRIC RATING
163rd/ 347
METRIC RANK
11.5%
DIVORCED OR SEPARATED
99.7/ 100
METRIC RATING
69th/ 347
METRIC RANK
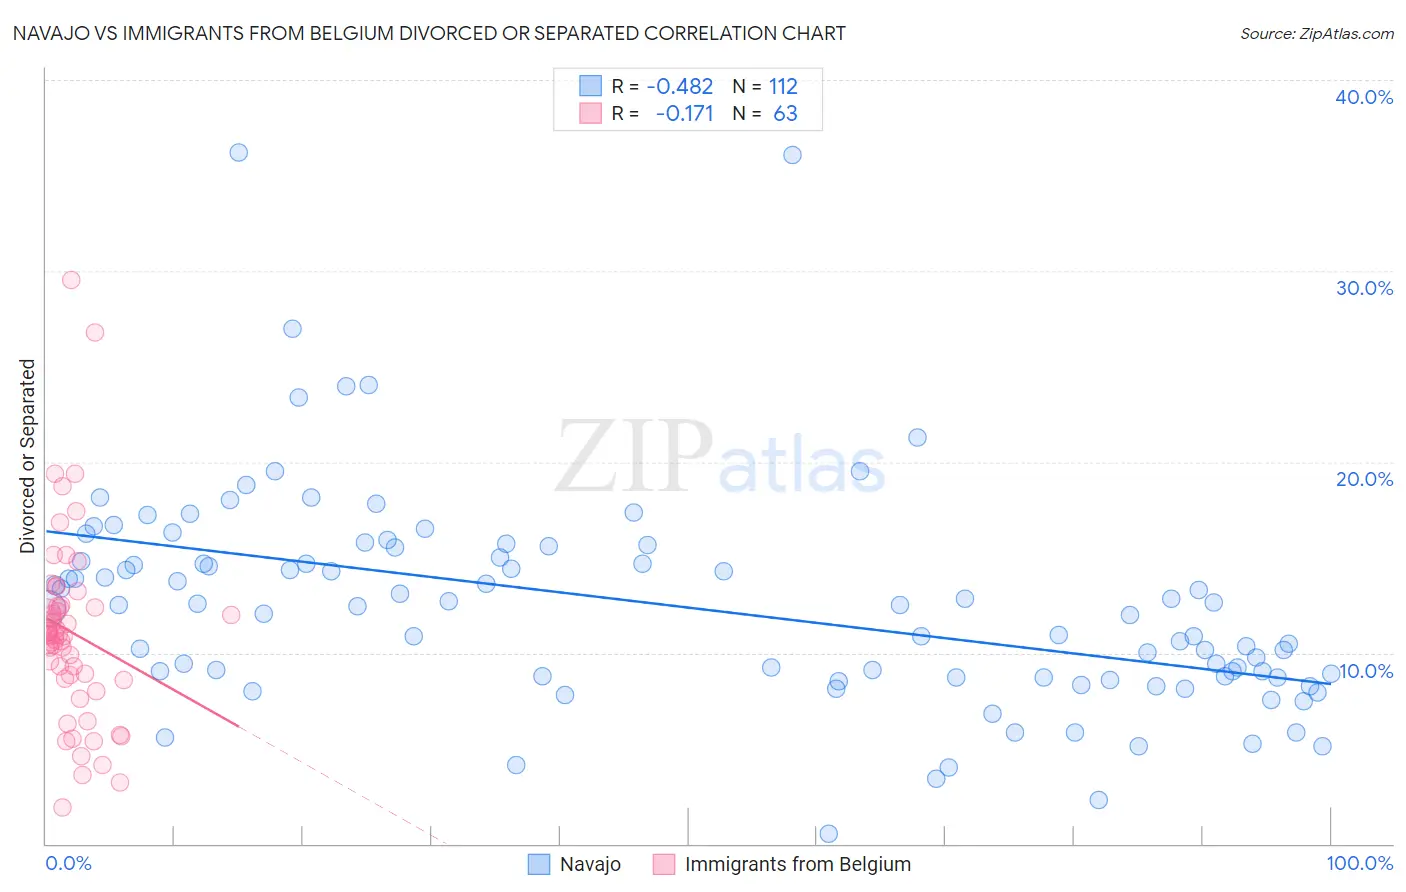
Navajo vs Immigrants from Belgium Divorced or Separated Correlation Chart
The statistical analysis conducted on geographies consisting of 224,845,032 people shows a moderate negative correlation between the proportion of Navajo and percentage of population currently divorced or separated in the United States with a correlation coefficient (R) of -0.482 and weighted average of 12.0%. Similarly, the statistical analysis conducted on geographies consisting of 146,701,736 people shows a poor negative correlation between the proportion of Immigrants from Belgium and percentage of population currently divorced or separated in the United States with a correlation coefficient (R) of -0.171 and weighted average of 11.5%, a difference of 4.8%.
Divorced or Separated Correlation Summary
| Measurement | Navajo | Immigrants from Belgium |
| Minimum | 0.50% | 1.9% |
| Maximum | 36.2% | 29.5% |
| Range | 35.7% | 27.6% |
| Mean | 12.5% | 11.1% |
| Median | 12.5% | 10.9% |
| Interquartile 25% (IQ1) | 8.7% | 8.6% |
| Interquartile 75% (IQ3) | 15.2% | 12.5% |
| Interquartile Range (IQR) | 6.5% | 3.8% |
| Standard Deviation (Sample) | 5.7% | 4.9% |
| Standard Deviation (Population) | 5.7% | 4.9% |
Similar Demographics by Divorced or Separated
Demographics Similar to Navajo by Divorced or Separated
In terms of divorced or separated, the demographic groups most similar to Navajo are Samoan (12.0%, a difference of 0.010%), Swiss (12.0%, a difference of 0.010%), Marshallese (12.0%, a difference of 0.030%), Immigrants from Scotland (12.0%, a difference of 0.070%), and Icelander (12.0%, a difference of 0.080%).
| Demographics | Rating | Rank | Divorced or Separated |
| Hungarians | 70.3 /100 | #156 | Good 12.0% |
| Immigrants | Brazil | 68.8 /100 | #157 | Good 12.0% |
| Icelanders | 66.0 /100 | #158 | Good 12.0% |
| Immigrants | Barbados | 66.0 /100 | #159 | Good 12.0% |
| Immigrants | Scotland | 65.8 /100 | #160 | Good 12.0% |
| Marshallese | 64.6 /100 | #161 | Good 12.0% |
| Samoans | 64.3 /100 | #162 | Good 12.0% |
| Navajo | 63.9 /100 | #163 | Good 12.0% |
| Swiss | 63.6 /100 | #164 | Good 12.0% |
| German Russians | 61.8 /100 | #165 | Good 12.0% |
| Tohono O'odham | 60.4 /100 | #166 | Good 12.0% |
| Ethiopians | 58.5 /100 | #167 | Average 12.0% |
| Serbians | 57.1 /100 | #168 | Average 12.0% |
| Immigrants | Peru | 57.0 /100 | #169 | Average 12.0% |
| Mexican American Indians | 55.8 /100 | #170 | Average 12.0% |
Demographics Similar to Immigrants from Belgium by Divorced or Separated
In terms of divorced or separated, the demographic groups most similar to Immigrants from Belgium are Palestinian (11.5%, a difference of 0.0%), Immigrants from Eastern Europe (11.5%, a difference of 0.010%), Immigrants from Syria (11.4%, a difference of 0.11%), Paraguayan (11.5%, a difference of 0.11%), and Jordanian (11.5%, a difference of 0.17%).
| Demographics | Rating | Rank | Divorced or Separated |
| Luxembourgers | 99.9 /100 | #62 | Exceptional 11.3% |
| Immigrants | Kuwait | 99.9 /100 | #63 | Exceptional 11.3% |
| Macedonians | 99.8 /100 | #64 | Exceptional 11.4% |
| Immigrants | South Eastern Asia | 99.8 /100 | #65 | Exceptional 11.4% |
| Inupiat | 99.8 /100 | #66 | Exceptional 11.4% |
| Immigrants | Syria | 99.7 /100 | #67 | Exceptional 11.4% |
| Palestinians | 99.7 /100 | #68 | Exceptional 11.5% |
| Immigrants | Belgium | 99.7 /100 | #69 | Exceptional 11.5% |
| Immigrants | Eastern Europe | 99.7 /100 | #70 | Exceptional 11.5% |
| Paraguayans | 99.7 /100 | #71 | Exceptional 11.5% |
| Jordanians | 99.6 /100 | #72 | Exceptional 11.5% |
| Immigrants | North Macedonia | 99.6 /100 | #73 | Exceptional 11.5% |
| Taiwanese | 99.6 /100 | #74 | Exceptional 11.5% |
| Immigrants | Northern Africa | 99.6 /100 | #75 | Exceptional 11.5% |
| Albanians | 99.6 /100 | #76 | Exceptional 11.5% |