Shoshone vs Central American Indian Divorced or Separated
COMPARE
Shoshone
Central American Indian
Divorced or Separated
Divorced or Separated Comparison
Shoshone
Central American Indians
14.0%
DIVORCED OR SEPARATED
0.0/ 100
METRIC RATING
336th/ 347
METRIC RANK
12.7%
DIVORCED OR SEPARATED
0.3/ 100
METRIC RATING
275th/ 347
METRIC RANK
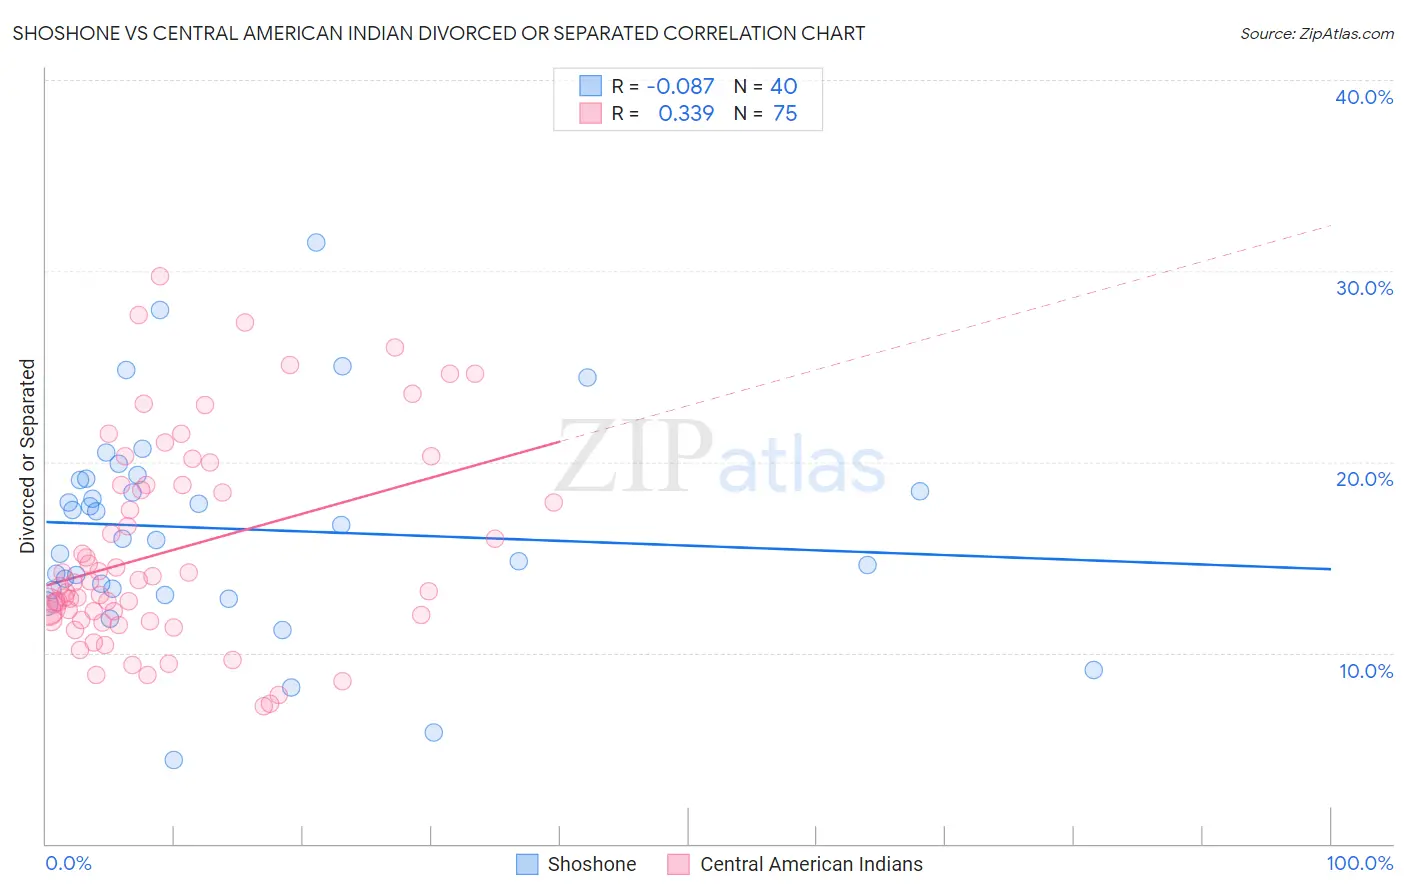
Shoshone vs Central American Indian Divorced or Separated Correlation Chart
The statistical analysis conducted on geographies consisting of 66,626,877 people shows a slight negative correlation between the proportion of Shoshone and percentage of population currently divorced or separated in the United States with a correlation coefficient (R) of -0.087 and weighted average of 14.0%. Similarly, the statistical analysis conducted on geographies consisting of 326,087,171 people shows a mild positive correlation between the proportion of Central American Indians and percentage of population currently divorced or separated in the United States with a correlation coefficient (R) of 0.339 and weighted average of 12.7%, a difference of 10.8%.
Divorced or Separated Correlation Summary
| Measurement | Shoshone | Central American Indian |
| Minimum | 4.4% | 7.2% |
| Maximum | 31.5% | 29.7% |
| Range | 27.1% | 22.5% |
| Mean | 16.5% | 15.3% |
| Median | 16.4% | 13.7% |
| Interquartile 25% (IQ1) | 13.3% | 11.7% |
| Interquartile 75% (IQ3) | 19.1% | 18.8% |
| Interquartile Range (IQR) | 5.7% | 7.1% |
| Standard Deviation (Sample) | 5.5% | 5.3% |
| Standard Deviation (Population) | 5.4% | 5.3% |
Similar Demographics by Divorced or Separated
Demographics Similar to Shoshone by Divorced or Separated
In terms of divorced or separated, the demographic groups most similar to Shoshone are Crow (14.1%, a difference of 0.28%), Dutch West Indian (14.0%, a difference of 0.34%), Choctaw (14.1%, a difference of 0.60%), Immigrants from Bahamas (13.9%, a difference of 0.95%), and Colville (14.2%, a difference of 1.1%).
| Demographics | Rating | Rank | Divorced or Separated |
| Houma | 0.0 /100 | #329 | Tragic 13.6% |
| Paiute | 0.0 /100 | #330 | Tragic 13.6% |
| Blacks/African Americans | 0.0 /100 | #331 | Tragic 13.6% |
| Cherokee | 0.0 /100 | #332 | Tragic 13.7% |
| Puerto Ricans | 0.0 /100 | #333 | Tragic 13.9% |
| Immigrants | Bahamas | 0.0 /100 | #334 | Tragic 13.9% |
| Dutch West Indians | 0.0 /100 | #335 | Tragic 14.0% |
| Shoshone | 0.0 /100 | #336 | Tragic 14.0% |
| Crow | 0.0 /100 | #337 | Tragic 14.1% |
| Choctaw | 0.0 /100 | #338 | Tragic 14.1% |
| Colville | 0.0 /100 | #339 | Tragic 14.2% |
| Chickasaw | 0.0 /100 | #340 | Tragic 14.2% |
| Bahamians | 0.0 /100 | #341 | Tragic 14.2% |
| Seminole | 0.0 /100 | #342 | Tragic 14.3% |
| Creek | 0.0 /100 | #343 | Tragic 14.4% |
Demographics Similar to Central American Indians by Divorced or Separated
In terms of divorced or separated, the demographic groups most similar to Central American Indians are Bermudan (12.7%, a difference of 0.020%), Immigrants from Micronesia (12.7%, a difference of 0.040%), Spaniard (12.7%, a difference of 0.060%), Dominican (12.7%, a difference of 0.11%), and Immigrants from Middle Africa (12.7%, a difference of 0.16%).
| Demographics | Rating | Rank | Divorced or Separated |
| Fijians | 0.4 /100 | #268 | Tragic 12.6% |
| Immigrants | Liberia | 0.4 /100 | #269 | Tragic 12.6% |
| Ute | 0.4 /100 | #270 | Tragic 12.6% |
| Panamanians | 0.3 /100 | #271 | Tragic 12.7% |
| Immigrants | Middle Africa | 0.3 /100 | #272 | Tragic 12.7% |
| Immigrants | Micronesia | 0.3 /100 | #273 | Tragic 12.7% |
| Bermudans | 0.3 /100 | #274 | Tragic 12.7% |
| Central American Indians | 0.3 /100 | #275 | Tragic 12.7% |
| Spaniards | 0.2 /100 | #276 | Tragic 12.7% |
| Dominicans | 0.2 /100 | #277 | Tragic 12.7% |
| Lumbee | 0.2 /100 | #278 | Tragic 12.7% |
| Immigrants | Dominican Republic | 0.2 /100 | #279 | Tragic 12.7% |
| Immigrants | Zaire | 0.2 /100 | #280 | Tragic 12.7% |
| Pueblo | 0.2 /100 | #281 | Tragic 12.7% |
| Sub-Saharan Africans | 0.1 /100 | #282 | Tragic 12.7% |