Kenyan vs Immigrants from Bolivia Average Family Size
COMPARE
Kenyan
Immigrants from Bolivia
Average Family Size
Average Family Size Comparison
Kenyans
Immigrants from Bolivia
3.21
AVERAGE FAMILY SIZE
28.0/ 100
METRIC RATING
197th/ 347
METRIC RANK
3.31
AVERAGE FAMILY SIZE
99.6/ 100
METRIC RATING
88th/ 347
METRIC RANK
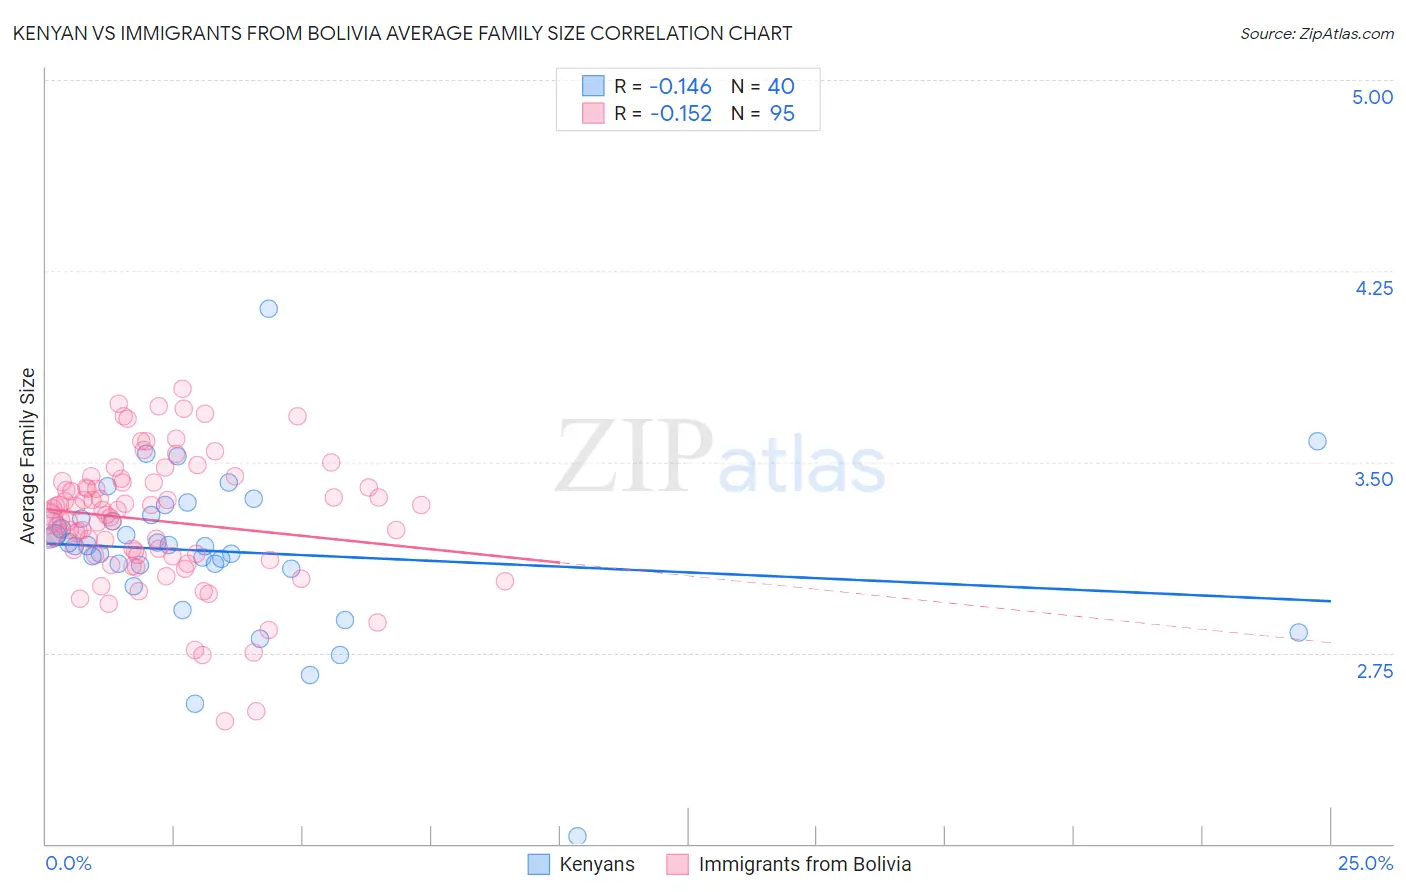
Kenyan vs Immigrants from Bolivia Average Family Size Correlation Chart
The statistical analysis conducted on geographies consisting of 168,172,391 people shows a poor negative correlation between the proportion of Kenyans and average family size in the United States with a correlation coefficient (R) of -0.146 and weighted average of 3.21. Similarly, the statistical analysis conducted on geographies consisting of 158,712,617 people shows a poor negative correlation between the proportion of Immigrants from Bolivia and average family size in the United States with a correlation coefficient (R) of -0.152 and weighted average of 3.31, a difference of 2.9%.
Average Family Size Correlation Summary
| Measurement | Kenyan | Immigrants from Bolivia |
| Minimum | 2.03 | 2.48 |
| Maximum | 4.10 | 3.79 |
| Range | 2.07 | 1.31 |
| Mean | 3.15 | 3.27 |
| Median | 3.17 | 3.29 |
| Interquartile 25% (IQ1) | 3.09 | 3.13 |
| Interquartile 75% (IQ3) | 3.28 | 3.42 |
| Interquartile Range (IQR) | 0.20 | 0.28 |
| Standard Deviation (Sample) | 0.32 | 0.25 |
| Standard Deviation (Population) | 0.32 | 0.25 |
Similar Demographics by Average Family Size
Demographics Similar to Kenyans by Average Family Size
In terms of average family size, the demographic groups most similar to Kenyans are Senegalese (3.21, a difference of 0.0%), Choctaw (3.21, a difference of 0.010%), Immigrants from Sudan (3.22, a difference of 0.020%), Immigrants from Israel (3.22, a difference of 0.030%), and Immigrants from Zaire (3.22, a difference of 0.050%).
| Demographics | Rating | Rank | Average Family Size |
| Burmese | 31.0 /100 | #190 | Fair 3.22 |
| Immigrants | Zaire | 30.5 /100 | #191 | Fair 3.22 |
| Immigrants | Eastern Africa | 30.1 /100 | #192 | Fair 3.22 |
| Immigrants | Israel | 29.3 /100 | #193 | Fair 3.22 |
| Immigrants | Sudan | 29.1 /100 | #194 | Fair 3.22 |
| Choctaw | 28.3 /100 | #195 | Fair 3.21 |
| Senegalese | 28.2 /100 | #196 | Fair 3.21 |
| Kenyans | 28.0 /100 | #197 | Fair 3.21 |
| Immigrants | Azores | 21.7 /100 | #198 | Fair 3.21 |
| Hmong | 20.7 /100 | #199 | Fair 3.21 |
| Immigrants | Kenya | 19.2 /100 | #200 | Poor 3.21 |
| Immigrants | Morocco | 18.5 /100 | #201 | Poor 3.21 |
| Immigrants | India | 18.5 /100 | #202 | Poor 3.21 |
| Immigrants | Nepal | 18.1 /100 | #203 | Poor 3.21 |
| Immigrants | Poland | 16.6 /100 | #204 | Poor 3.20 |
Demographics Similar to Immigrants from Bolivia by Average Family Size
In terms of average family size, the demographic groups most similar to Immigrants from Bolivia are Malaysian (3.31, a difference of 0.010%), Immigrants from Peru (3.31, a difference of 0.090%), Menominee (3.30, a difference of 0.12%), Jamaican (3.31, a difference of 0.14%), and Afghan (3.31, a difference of 0.16%).
| Demographics | Rating | Rank | Average Family Size |
| Immigrants | Dominica | 99.8 /100 | #81 | Exceptional 3.32 |
| Ecuadorians | 99.8 /100 | #82 | Exceptional 3.32 |
| Immigrants | Afghanistan | 99.8 /100 | #83 | Exceptional 3.32 |
| Immigrants | Nigeria | 99.7 /100 | #84 | Exceptional 3.32 |
| Afghans | 99.7 /100 | #85 | Exceptional 3.31 |
| Jamaicans | 99.7 /100 | #86 | Exceptional 3.31 |
| Immigrants | Peru | 99.7 /100 | #87 | Exceptional 3.31 |
| Immigrants | Bolivia | 99.6 /100 | #88 | Exceptional 3.31 |
| Malaysians | 99.6 /100 | #89 | Exceptional 3.31 |
| Menominee | 99.4 /100 | #90 | Exceptional 3.30 |
| Immigrants | Pakistan | 99.2 /100 | #91 | Exceptional 3.30 |
| Immigrants | Cameroon | 99.2 /100 | #92 | Exceptional 3.30 |
| Peruvians | 99.2 /100 | #93 | Exceptional 3.30 |
| Sierra Leoneans | 99.0 /100 | #94 | Exceptional 3.30 |
| Immigrants | Lebanon | 99.0 /100 | #95 | Exceptional 3.30 |