Kenyan vs Immigrants from Spain Average Family Size
COMPARE
Kenyan
Immigrants from Spain
Average Family Size
Average Family Size Comparison
Kenyans
Immigrants from Spain
3.21
AVERAGE FAMILY SIZE
28.0/ 100
METRIC RATING
197th/ 347
METRIC RANK
3.17
AVERAGE FAMILY SIZE
1.8/ 100
METRIC RATING
251st/ 347
METRIC RANK
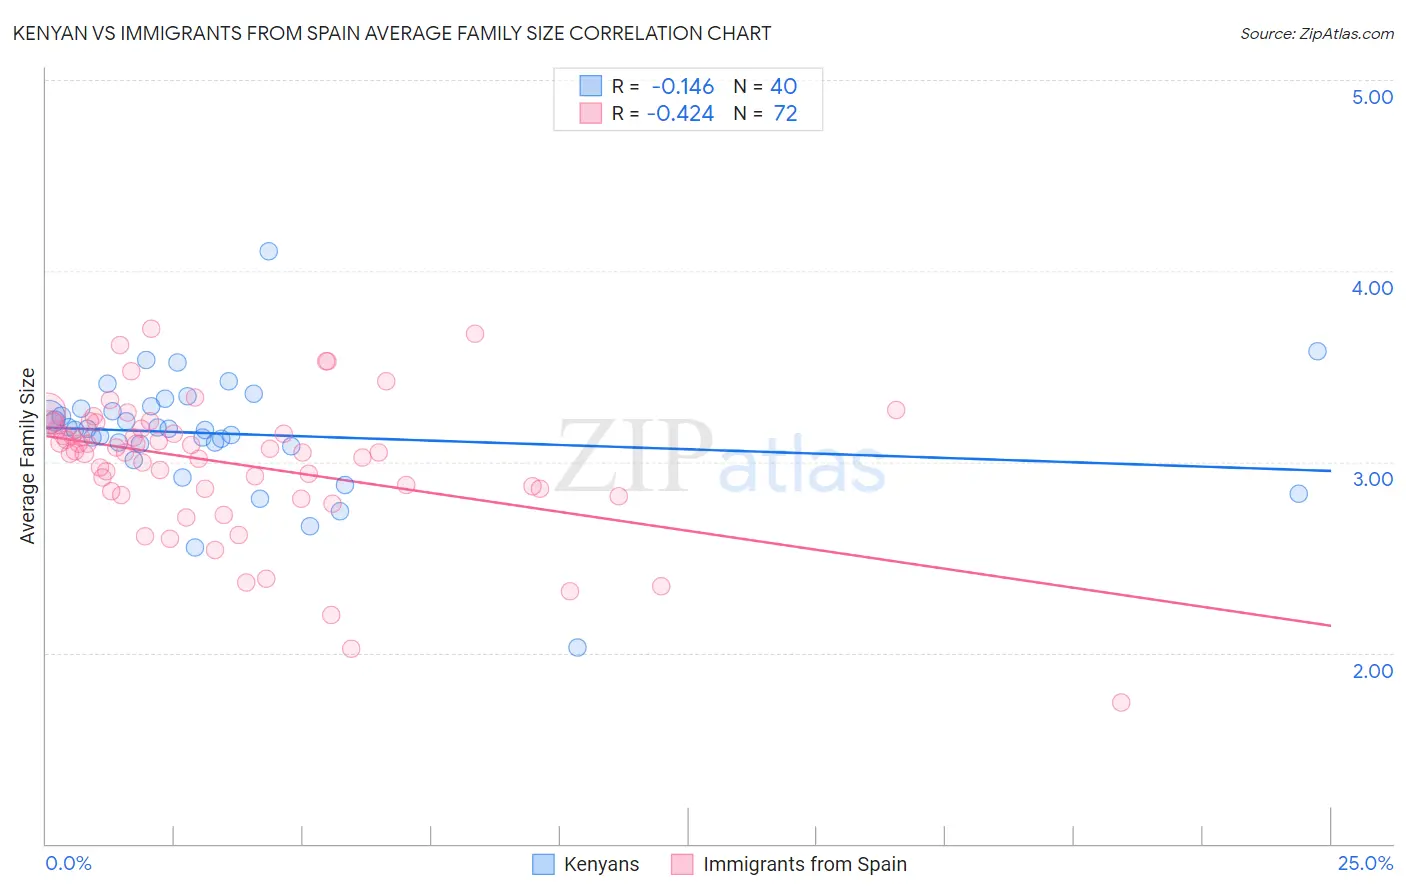
Kenyan vs Immigrants from Spain Average Family Size Correlation Chart
The statistical analysis conducted on geographies consisting of 168,172,391 people shows a poor negative correlation between the proportion of Kenyans and average family size in the United States with a correlation coefficient (R) of -0.146 and weighted average of 3.21. Similarly, the statistical analysis conducted on geographies consisting of 239,606,495 people shows a moderate negative correlation between the proportion of Immigrants from Spain and average family size in the United States with a correlation coefficient (R) of -0.424 and weighted average of 3.17, a difference of 1.4%.
Average Family Size Correlation Summary
| Measurement | Kenyan | Immigrants from Spain |
| Minimum | 2.03 | 1.74 |
| Maximum | 4.10 | 3.70 |
| Range | 2.07 | 1.96 |
| Mean | 3.15 | 2.99 |
| Median | 3.17 | 3.05 |
| Interquartile 25% (IQ1) | 3.09 | 2.85 |
| Interquartile 75% (IQ3) | 3.28 | 3.19 |
| Interquartile Range (IQR) | 0.20 | 0.33 |
| Standard Deviation (Sample) | 0.32 | 0.36 |
| Standard Deviation (Population) | 0.32 | 0.36 |
Similar Demographics by Average Family Size
Demographics Similar to Kenyans by Average Family Size
In terms of average family size, the demographic groups most similar to Kenyans are Senegalese (3.21, a difference of 0.0%), Choctaw (3.21, a difference of 0.010%), Immigrants from Sudan (3.22, a difference of 0.020%), Immigrants from Israel (3.22, a difference of 0.030%), and Immigrants from Zaire (3.22, a difference of 0.050%).
| Demographics | Rating | Rank | Average Family Size |
| Burmese | 31.0 /100 | #190 | Fair 3.22 |
| Immigrants | Zaire | 30.5 /100 | #191 | Fair 3.22 |
| Immigrants | Eastern Africa | 30.1 /100 | #192 | Fair 3.22 |
| Immigrants | Israel | 29.3 /100 | #193 | Fair 3.22 |
| Immigrants | Sudan | 29.1 /100 | #194 | Fair 3.22 |
| Choctaw | 28.3 /100 | #195 | Fair 3.21 |
| Senegalese | 28.2 /100 | #196 | Fair 3.21 |
| Kenyans | 28.0 /100 | #197 | Fair 3.21 |
| Immigrants | Azores | 21.7 /100 | #198 | Fair 3.21 |
| Hmong | 20.7 /100 | #199 | Fair 3.21 |
| Immigrants | Kenya | 19.2 /100 | #200 | Poor 3.21 |
| Immigrants | Morocco | 18.5 /100 | #201 | Poor 3.21 |
| Immigrants | India | 18.5 /100 | #202 | Poor 3.21 |
| Immigrants | Nepal | 18.1 /100 | #203 | Poor 3.21 |
| Immigrants | Poland | 16.6 /100 | #204 | Poor 3.20 |
Demographics Similar to Immigrants from Spain by Average Family Size
In terms of average family size, the demographic groups most similar to Immigrants from Spain are Puget Sound Salish (3.17, a difference of 0.010%), Immigrants from Saudi Arabia (3.17, a difference of 0.030%), South African (3.17, a difference of 0.030%), Immigrants from Hungary (3.17, a difference of 0.040%), and Cape Verdean (3.17, a difference of 0.050%).
| Demographics | Rating | Rank | Average Family Size |
| Immigrants | Southern Europe | 2.9 /100 | #244 | Tragic 3.18 |
| Immigrants | Brazil | 2.7 /100 | #245 | Tragic 3.18 |
| Danes | 2.5 /100 | #246 | Tragic 3.17 |
| Cajuns | 2.4 /100 | #247 | Tragic 3.17 |
| Immigrants | Belarus | 2.3 /100 | #248 | Tragic 3.17 |
| Immigrants | Eastern Europe | 2.1 /100 | #249 | Tragic 3.17 |
| Puget Sound Salish | 1.9 /100 | #250 | Tragic 3.17 |
| Immigrants | Spain | 1.8 /100 | #251 | Tragic 3.17 |
| Immigrants | Saudi Arabia | 1.7 /100 | #252 | Tragic 3.17 |
| South Africans | 1.7 /100 | #253 | Tragic 3.17 |
| Immigrants | Hungary | 1.7 /100 | #254 | Tragic 3.17 |
| Cape Verdeans | 1.6 /100 | #255 | Tragic 3.17 |
| Immigrants | Kazakhstan | 1.5 /100 | #256 | Tragic 3.17 |
| Albanians | 1.5 /100 | #257 | Tragic 3.17 |
| Turks | 1.3 /100 | #258 | Tragic 3.16 |