Marshallese vs Seminole Average Family Size
COMPARE
Marshallese
Seminole
Average Family Size
Average Family Size Comparison
Marshallese
Seminole
3.38
AVERAGE FAMILY SIZE
100.0/ 100
METRIC RATING
41st/ 347
METRIC RANK
3.24
AVERAGE FAMILY SIZE
68.2/ 100
METRIC RATING
155th/ 347
METRIC RANK
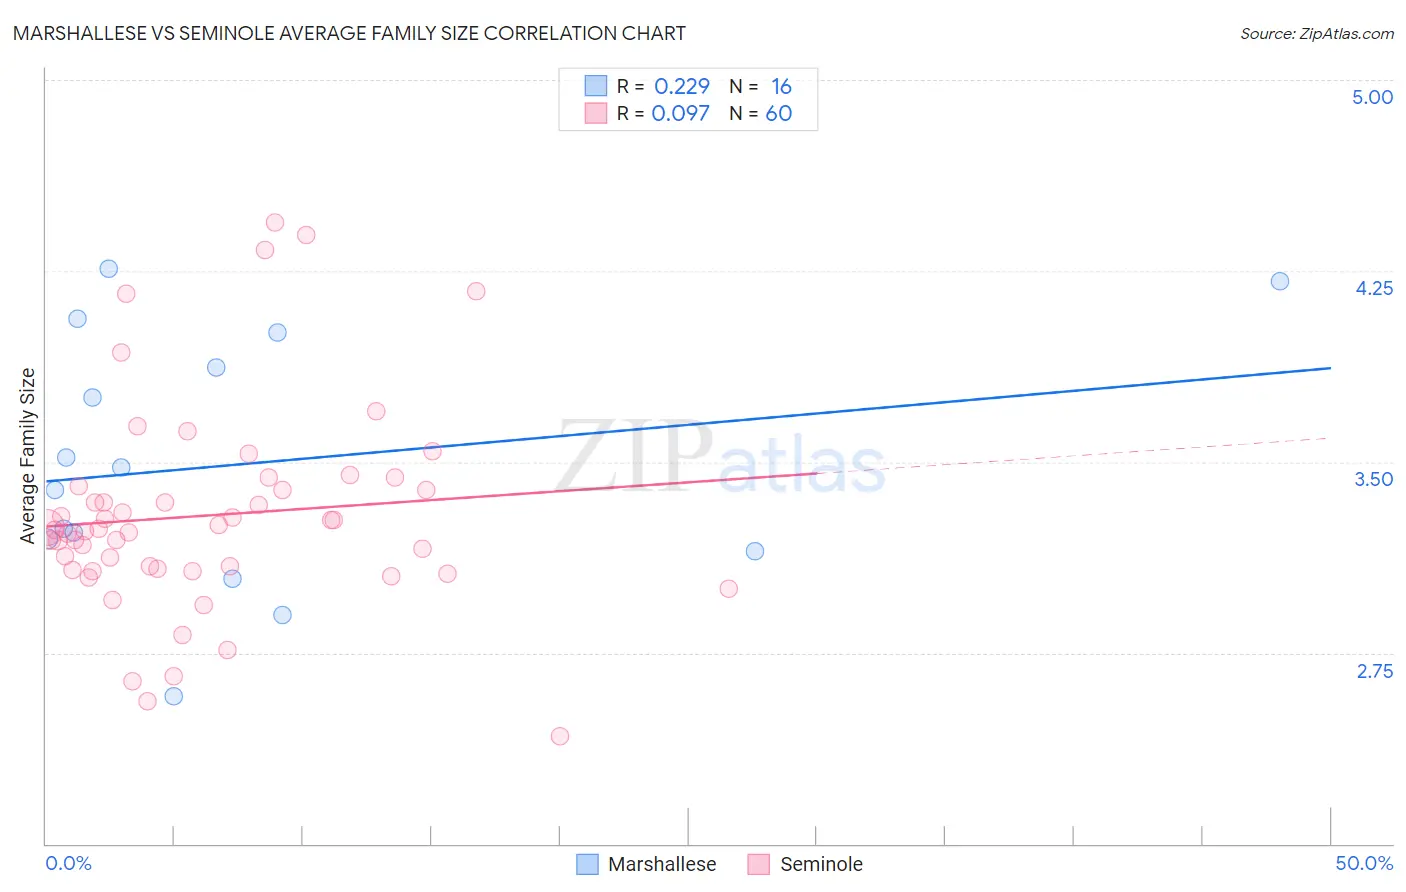
Marshallese vs Seminole Average Family Size Correlation Chart
The statistical analysis conducted on geographies consisting of 14,761,315 people shows a weak positive correlation between the proportion of Marshallese and average family size in the United States with a correlation coefficient (R) of 0.229 and weighted average of 3.38. Similarly, the statistical analysis conducted on geographies consisting of 118,298,481 people shows a slight positive correlation between the proportion of Seminole and average family size in the United States with a correlation coefficient (R) of 0.097 and weighted average of 3.24, a difference of 4.3%.
Average Family Size Correlation Summary
| Measurement | Marshallese | Seminole |
| Minimum | 2.58 | 2.42 |
| Maximum | 4.26 | 4.44 |
| Range | 1.68 | 2.02 |
| Mean | 3.49 | 3.29 |
| Median | 3.43 | 3.24 |
| Interquartile 25% (IQ1) | 3.17 | 3.08 |
| Interquartile 75% (IQ3) | 3.94 | 3.40 |
| Interquartile Range (IQR) | 0.76 | 0.32 |
| Standard Deviation (Sample) | 0.49 | 0.41 |
| Standard Deviation (Population) | 0.48 | 0.40 |
Similar Demographics by Average Family Size
Demographics Similar to Marshallese by Average Family Size
In terms of average family size, the demographic groups most similar to Marshallese are Immigrants from Vietnam (3.38, a difference of 0.060%), Immigrants from Philippines (3.37, a difference of 0.16%), Belizean (3.39, a difference of 0.17%), Alaska Native (3.37, a difference of 0.17%), and Shoshone (3.37, a difference of 0.20%).
| Demographics | Rating | Rank | Average Family Size |
| Hispanics or Latinos | 100.0 /100 | #34 | Exceptional 3.41 |
| Guatemalans | 100.0 /100 | #35 | Exceptional 3.40 |
| Immigrants | Guyana | 100.0 /100 | #36 | Exceptional 3.40 |
| Guyanese | 100.0 /100 | #37 | Exceptional 3.40 |
| Immigrants | Belize | 100.0 /100 | #38 | Exceptional 3.39 |
| Immigrants | Haiti | 100.0 /100 | #39 | Exceptional 3.39 |
| Belizeans | 100.0 /100 | #40 | Exceptional 3.39 |
| Marshallese | 100.0 /100 | #41 | Exceptional 3.38 |
| Immigrants | Vietnam | 100.0 /100 | #42 | Exceptional 3.38 |
| Immigrants | Philippines | 100.0 /100 | #43 | Exceptional 3.37 |
| Alaska Natives | 100.0 /100 | #44 | Exceptional 3.37 |
| Shoshone | 100.0 /100 | #45 | Exceptional 3.37 |
| Haitians | 100.0 /100 | #46 | Exceptional 3.37 |
| Vietnamese | 100.0 /100 | #47 | Exceptional 3.37 |
| Immigrants | Nicaragua | 100.0 /100 | #48 | Exceptional 3.37 |
Demographics Similar to Seminole by Average Family Size
In terms of average family size, the demographic groups most similar to Seminole are Immigrants from Taiwan (3.24, a difference of 0.0%), Immigrants from Uzbekistan (3.24, a difference of 0.020%), Immigrants from Egypt (3.24, a difference of 0.040%), Immigrants from Eritrea (3.24, a difference of 0.070%), and Iraqi (3.24, a difference of 0.080%).
| Demographics | Rating | Rank | Average Family Size |
| Blackfeet | 75.0 /100 | #148 | Good 3.24 |
| Assyrians/Chaldeans/Syriacs | 73.8 /100 | #149 | Good 3.24 |
| Indians (Asian) | 73.6 /100 | #150 | Good 3.24 |
| Jordanians | 73.5 /100 | #151 | Good 3.24 |
| Spanish Americans | 72.5 /100 | #152 | Good 3.24 |
| Immigrants | Eritrea | 71.4 /100 | #153 | Good 3.24 |
| Immigrants | Egypt | 70.0 /100 | #154 | Good 3.24 |
| Seminole | 68.2 /100 | #155 | Good 3.24 |
| Immigrants | Taiwan | 68.1 /100 | #156 | Good 3.24 |
| Immigrants | Uzbekistan | 67.0 /100 | #157 | Good 3.24 |
| Iraqis | 64.3 /100 | #158 | Good 3.24 |
| Ethiopians | 63.9 /100 | #159 | Good 3.24 |
| Immigrants | Iraq | 63.7 /100 | #160 | Good 3.24 |
| Immigrants | Chile | 63.2 /100 | #161 | Good 3.24 |
| Immigrants | Uganda | 60.1 /100 | #162 | Good 3.23 |