Kenyan vs Alaska Native Average Family Size
COMPARE
Kenyan
Alaska Native
Average Family Size
Average Family Size Comparison
Kenyans
Alaska Natives
3.21
AVERAGE FAMILY SIZE
28.0/ 100
METRIC RATING
197th/ 347
METRIC RANK
3.37
AVERAGE FAMILY SIZE
100.0/ 100
METRIC RATING
44th/ 347
METRIC RANK
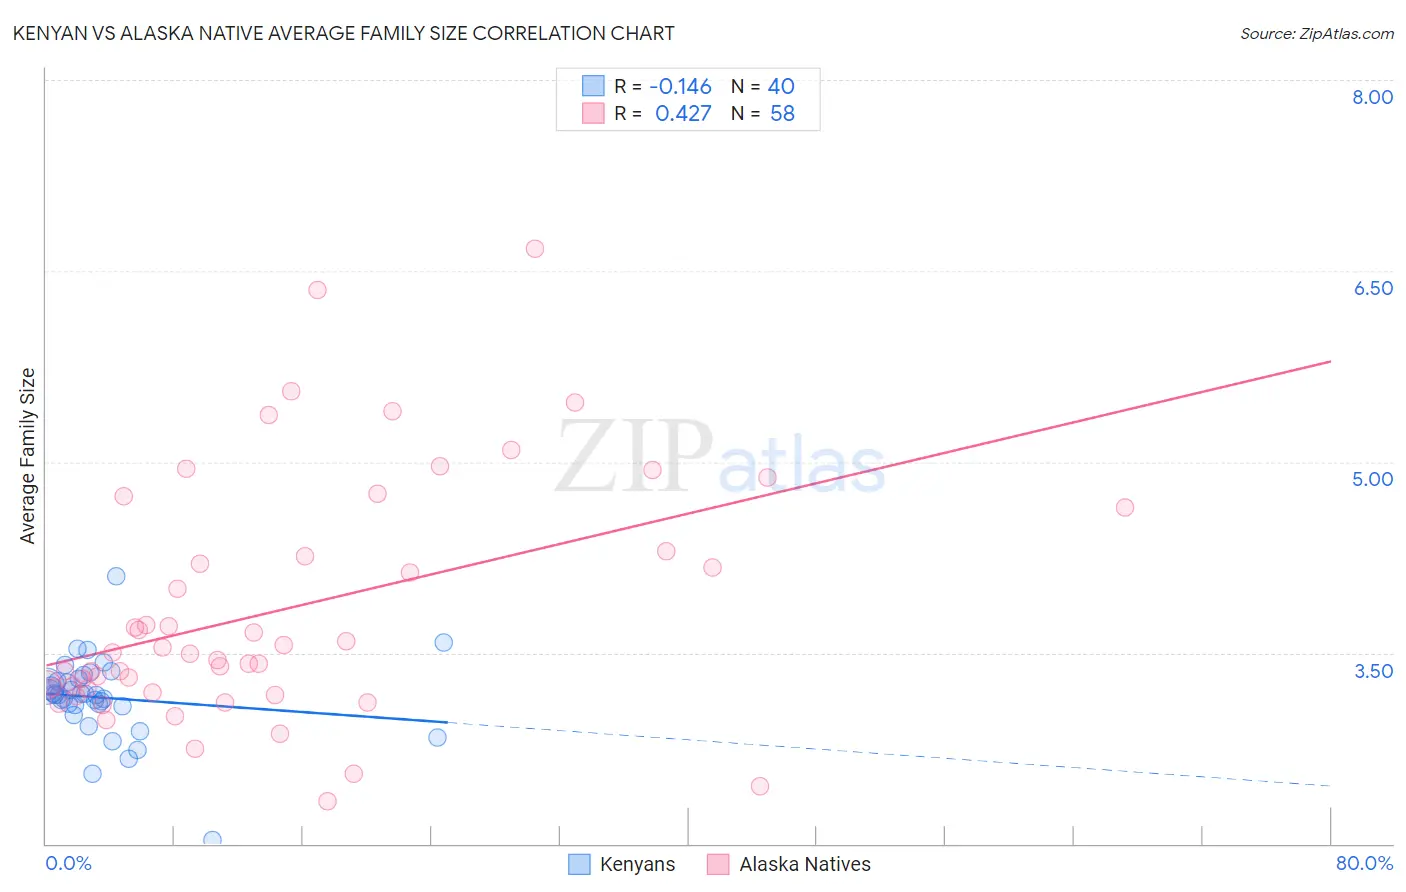
Kenyan vs Alaska Native Average Family Size Correlation Chart
The statistical analysis conducted on geographies consisting of 168,172,391 people shows a poor negative correlation between the proportion of Kenyans and average family size in the United States with a correlation coefficient (R) of -0.146 and weighted average of 3.21. Similarly, the statistical analysis conducted on geographies consisting of 76,756,389 people shows a moderate positive correlation between the proportion of Alaska Natives and average family size in the United States with a correlation coefficient (R) of 0.427 and weighted average of 3.37, a difference of 5.0%.
Average Family Size Correlation Summary
| Measurement | Kenyan | Alaska Native |
| Minimum | 2.03 | 2.33 |
| Maximum | 4.10 | 6.67 |
| Range | 2.07 | 4.34 |
| Mean | 3.15 | 3.83 |
| Median | 3.17 | 3.50 |
| Interquartile 25% (IQ1) | 3.09 | 3.22 |
| Interquartile 75% (IQ3) | 3.28 | 4.30 |
| Interquartile Range (IQR) | 0.20 | 1.08 |
| Standard Deviation (Sample) | 0.32 | 0.95 |
| Standard Deviation (Population) | 0.32 | 0.94 |
Similar Demographics by Average Family Size
Demographics Similar to Kenyans by Average Family Size
In terms of average family size, the demographic groups most similar to Kenyans are Senegalese (3.21, a difference of 0.0%), Choctaw (3.21, a difference of 0.010%), Immigrants from Sudan (3.22, a difference of 0.020%), Immigrants from Israel (3.22, a difference of 0.030%), and Immigrants from Zaire (3.22, a difference of 0.050%).
| Demographics | Rating | Rank | Average Family Size |
| Burmese | 31.0 /100 | #190 | Fair 3.22 |
| Immigrants | Zaire | 30.5 /100 | #191 | Fair 3.22 |
| Immigrants | Eastern Africa | 30.1 /100 | #192 | Fair 3.22 |
| Immigrants | Israel | 29.3 /100 | #193 | Fair 3.22 |
| Immigrants | Sudan | 29.1 /100 | #194 | Fair 3.22 |
| Choctaw | 28.3 /100 | #195 | Fair 3.21 |
| Senegalese | 28.2 /100 | #196 | Fair 3.21 |
| Kenyans | 28.0 /100 | #197 | Fair 3.21 |
| Immigrants | Azores | 21.7 /100 | #198 | Fair 3.21 |
| Hmong | 20.7 /100 | #199 | Fair 3.21 |
| Immigrants | Kenya | 19.2 /100 | #200 | Poor 3.21 |
| Immigrants | Morocco | 18.5 /100 | #201 | Poor 3.21 |
| Immigrants | India | 18.5 /100 | #202 | Poor 3.21 |
| Immigrants | Nepal | 18.1 /100 | #203 | Poor 3.21 |
| Immigrants | Poland | 16.6 /100 | #204 | Poor 3.20 |
Demographics Similar to Alaska Natives by Average Family Size
In terms of average family size, the demographic groups most similar to Alaska Natives are Immigrants from Philippines (3.37, a difference of 0.010%), Shoshone (3.37, a difference of 0.030%), Haitian (3.37, a difference of 0.090%), Immigrants from Vietnam (3.38, a difference of 0.11%), and Vietnamese (3.37, a difference of 0.13%).
| Demographics | Rating | Rank | Average Family Size |
| Guyanese | 100.0 /100 | #37 | Exceptional 3.40 |
| Immigrants | Belize | 100.0 /100 | #38 | Exceptional 3.39 |
| Immigrants | Haiti | 100.0 /100 | #39 | Exceptional 3.39 |
| Belizeans | 100.0 /100 | #40 | Exceptional 3.39 |
| Marshallese | 100.0 /100 | #41 | Exceptional 3.38 |
| Immigrants | Vietnam | 100.0 /100 | #42 | Exceptional 3.38 |
| Immigrants | Philippines | 100.0 /100 | #43 | Exceptional 3.37 |
| Alaska Natives | 100.0 /100 | #44 | Exceptional 3.37 |
| Shoshone | 100.0 /100 | #45 | Exceptional 3.37 |
| Haitians | 100.0 /100 | #46 | Exceptional 3.37 |
| Vietnamese | 100.0 /100 | #47 | Exceptional 3.37 |
| Immigrants | Nicaragua | 100.0 /100 | #48 | Exceptional 3.37 |
| Bangladeshis | 100.0 /100 | #49 | Exceptional 3.37 |
| Immigrants | Bangladesh | 100.0 /100 | #50 | Exceptional 3.36 |
| Nicaraguans | 100.0 /100 | #51 | Exceptional 3.36 |