Kenyan vs Yuman Average Family Size
COMPARE
Kenyan
Yuman
Average Family Size
Average Family Size Comparison
Kenyans
Yuman
3.21
AVERAGE FAMILY SIZE
28.0/ 100
METRIC RATING
197th/ 347
METRIC RANK
3.47
AVERAGE FAMILY SIZE
100.0/ 100
METRIC RATING
21st/ 347
METRIC RANK
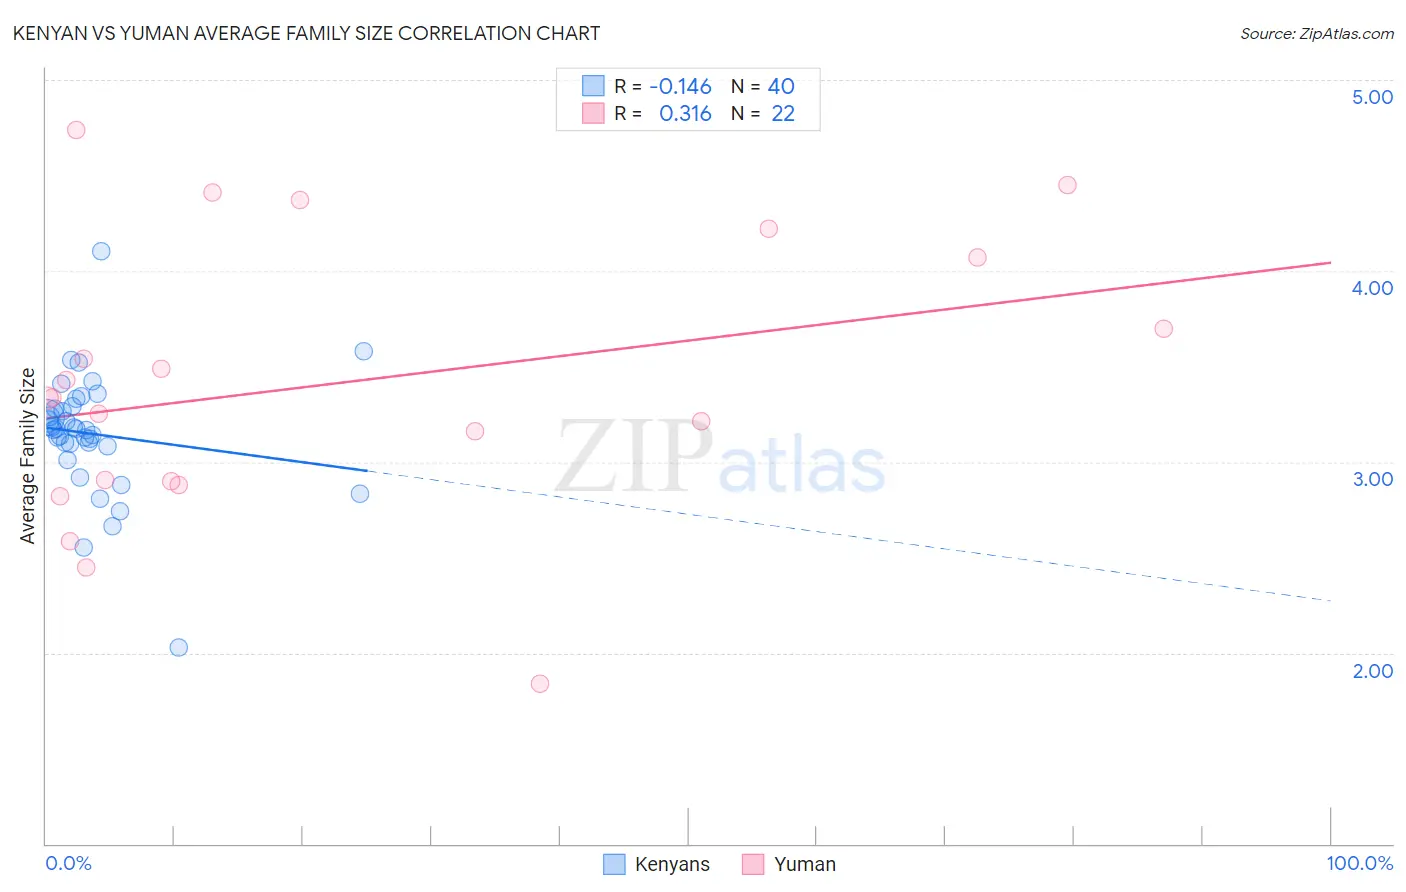
Kenyan vs Yuman Average Family Size Correlation Chart
The statistical analysis conducted on geographies consisting of 168,172,391 people shows a poor negative correlation between the proportion of Kenyans and average family size in the United States with a correlation coefficient (R) of -0.146 and weighted average of 3.21. Similarly, the statistical analysis conducted on geographies consisting of 40,663,604 people shows a mild positive correlation between the proportion of Yuman and average family size in the United States with a correlation coefficient (R) of 0.316 and weighted average of 3.47, a difference of 7.8%.
Average Family Size Correlation Summary
| Measurement | Kenyan | Yuman |
| Minimum | 2.03 | 1.84 |
| Maximum | 4.10 | 4.74 |
| Range | 2.07 | 2.90 |
| Mean | 3.15 | 3.41 |
| Median | 3.17 | 3.33 |
| Interquartile 25% (IQ1) | 3.09 | 2.90 |
| Interquartile 75% (IQ3) | 3.28 | 4.07 |
| Interquartile Range (IQR) | 0.20 | 1.17 |
| Standard Deviation (Sample) | 0.32 | 0.73 |
| Standard Deviation (Population) | 0.32 | 0.72 |
Similar Demographics by Average Family Size
Demographics Similar to Kenyans by Average Family Size
In terms of average family size, the demographic groups most similar to Kenyans are Senegalese (3.21, a difference of 0.0%), Choctaw (3.21, a difference of 0.010%), Immigrants from Sudan (3.22, a difference of 0.020%), Immigrants from Israel (3.22, a difference of 0.030%), and Immigrants from Zaire (3.22, a difference of 0.050%).
| Demographics | Rating | Rank | Average Family Size |
| Burmese | 31.0 /100 | #190 | Fair 3.22 |
| Immigrants | Zaire | 30.5 /100 | #191 | Fair 3.22 |
| Immigrants | Eastern Africa | 30.1 /100 | #192 | Fair 3.22 |
| Immigrants | Israel | 29.3 /100 | #193 | Fair 3.22 |
| Immigrants | Sudan | 29.1 /100 | #194 | Fair 3.22 |
| Choctaw | 28.3 /100 | #195 | Fair 3.21 |
| Senegalese | 28.2 /100 | #196 | Fair 3.21 |
| Kenyans | 28.0 /100 | #197 | Fair 3.21 |
| Immigrants | Azores | 21.7 /100 | #198 | Fair 3.21 |
| Hmong | 20.7 /100 | #199 | Fair 3.21 |
| Immigrants | Kenya | 19.2 /100 | #200 | Poor 3.21 |
| Immigrants | Morocco | 18.5 /100 | #201 | Poor 3.21 |
| Immigrants | India | 18.5 /100 | #202 | Poor 3.21 |
| Immigrants | Nepal | 18.1 /100 | #203 | Poor 3.21 |
| Immigrants | Poland | 16.6 /100 | #204 | Poor 3.20 |
Demographics Similar to Yuman by Average Family Size
In terms of average family size, the demographic groups most similar to Yuman are Apache (3.46, a difference of 0.060%), Cheyenne (3.47, a difference of 0.25%), Mexican (3.48, a difference of 0.30%), Immigrants from Fiji (3.45, a difference of 0.35%), and Salvadoran (3.48, a difference of 0.36%).
| Demographics | Rating | Rank | Average Family Size |
| Immigrants | Central America | 100.0 /100 | #14 | Exceptional 3.49 |
| Tongans | 100.0 /100 | #15 | Exceptional 3.49 |
| Ute | 100.0 /100 | #16 | Exceptional 3.49 |
| Immigrants | El Salvador | 100.0 /100 | #17 | Exceptional 3.49 |
| Salvadorans | 100.0 /100 | #18 | Exceptional 3.48 |
| Mexicans | 100.0 /100 | #19 | Exceptional 3.48 |
| Cheyenne | 100.0 /100 | #20 | Exceptional 3.47 |
| Yuman | 100.0 /100 | #21 | Exceptional 3.47 |
| Apache | 100.0 /100 | #22 | Exceptional 3.46 |
| Immigrants | Fiji | 100.0 /100 | #23 | Exceptional 3.45 |
| Natives/Alaskans | 100.0 /100 | #24 | Exceptional 3.45 |
| Yakama | 100.0 /100 | #25 | Exceptional 3.45 |
| Native Hawaiians | 100.0 /100 | #26 | Exceptional 3.43 |
| Mexican American Indians | 100.0 /100 | #27 | Exceptional 3.43 |
| Immigrants | Latin America | 100.0 /100 | #28 | Exceptional 3.42 |