Kenyan vs Immigrants from Cabo Verde 8th Grade
COMPARE
Kenyan
Immigrants from Cabo Verde
8th Grade
8th Grade Comparison
Kenyans
Immigrants from Cabo Verde
95.9%
8TH GRADE
74.5/ 100
METRIC RATING
155th/ 347
METRIC RANK
92.4%
8TH GRADE
0.0/ 100
METRIC RATING
329th/ 347
METRIC RANK
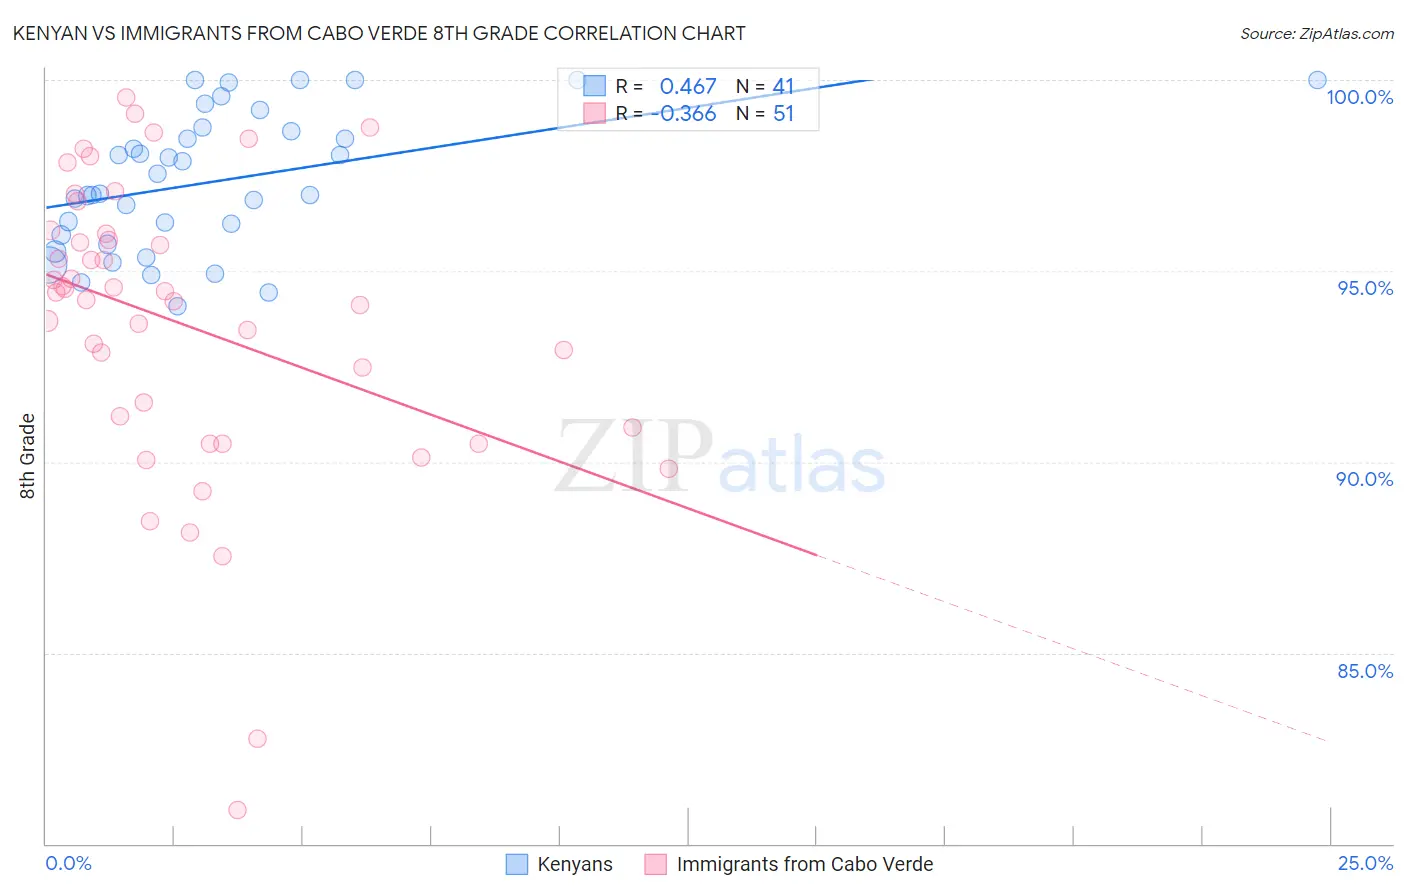
Kenyan vs Immigrants from Cabo Verde 8th Grade Correlation Chart
The statistical analysis conducted on geographies consisting of 168,244,042 people shows a moderate positive correlation between the proportion of Kenyans and percentage of population with at least 8th grade education in the United States with a correlation coefficient (R) of 0.467 and weighted average of 95.9%. Similarly, the statistical analysis conducted on geographies consisting of 38,158,316 people shows a mild negative correlation between the proportion of Immigrants from Cabo Verde and percentage of population with at least 8th grade education in the United States with a correlation coefficient (R) of -0.366 and weighted average of 92.4%, a difference of 3.8%.
8th Grade Correlation Summary
| Measurement | Kenyan | Immigrants from Cabo Verde |
| Minimum | 94.1% | 80.9% |
| Maximum | 100.0% | 99.5% |
| Range | 5.9% | 18.6% |
| Mean | 97.3% | 93.6% |
| Median | 97.0% | 94.4% |
| Interquartile 25% (IQ1) | 95.8% | 90.9% |
| Interquartile 75% (IQ3) | 98.7% | 96.0% |
| Interquartile Range (IQR) | 2.9% | 5.1% |
| Standard Deviation (Sample) | 1.8% | 3.9% |
| Standard Deviation (Population) | 1.8% | 3.8% |
Similar Demographics by 8th Grade
Demographics Similar to Kenyans by 8th Grade
In terms of 8th grade, the demographic groups most similar to Kenyans are Ugandan (95.9%, a difference of 0.0%), Immigrants from Taiwan (95.9%, a difference of 0.030%), Hopi (95.9%, a difference of 0.040%), Arab (95.9%, a difference of 0.040%), and Immigrants from Jordan (95.9%, a difference of 0.050%).
| Demographics | Rating | Rank | 8th Grade |
| Albanians | 83.1 /100 | #148 | Excellent 96.0% |
| Immigrants | Israel | 81.3 /100 | #149 | Excellent 96.0% |
| Immigrants | Russia | 80.9 /100 | #150 | Excellent 96.0% |
| Blackfeet | 80.8 /100 | #151 | Excellent 96.0% |
| French American Indians | 80.6 /100 | #152 | Excellent 96.0% |
| Immigrants | Jordan | 79.5 /100 | #153 | Good 95.9% |
| Hopi | 79.4 /100 | #154 | Good 95.9% |
| Kenyans | 74.5 /100 | #155 | Good 95.9% |
| Ugandans | 74.1 /100 | #156 | Good 95.9% |
| Immigrants | Taiwan | 70.5 /100 | #157 | Good 95.9% |
| Arabs | 69.4 /100 | #158 | Good 95.9% |
| Immigrants | Kazakhstan | 68.4 /100 | #159 | Good 95.9% |
| Seminole | 67.7 /100 | #160 | Good 95.8% |
| Bermudans | 67.5 /100 | #161 | Good 95.8% |
| Immigrants | Kenya | 67.2 /100 | #162 | Good 95.8% |
Demographics Similar to Immigrants from Cabo Verde by 8th Grade
In terms of 8th grade, the demographic groups most similar to Immigrants from Cabo Verde are Immigrants from Nicaragua (92.5%, a difference of 0.060%), Immigrants from the Azores (92.5%, a difference of 0.090%), Immigrants from Armenia (92.3%, a difference of 0.090%), Honduran (92.3%, a difference of 0.090%), and Immigrants from Dominican Republic (92.3%, a difference of 0.11%).
| Demographics | Rating | Rank | 8th Grade |
| Nicaraguans | 0.0 /100 | #322 | Tragic 93.0% |
| Immigrants | Belize | 0.0 /100 | #323 | Tragic 92.9% |
| Nepalese | 0.0 /100 | #324 | Tragic 92.8% |
| Dominicans | 0.0 /100 | #325 | Tragic 92.8% |
| Central American Indians | 0.0 /100 | #326 | Tragic 92.7% |
| Immigrants | Azores | 0.0 /100 | #327 | Tragic 92.5% |
| Immigrants | Nicaragua | 0.0 /100 | #328 | Tragic 92.5% |
| Immigrants | Cabo Verde | 0.0 /100 | #329 | Tragic 92.4% |
| Immigrants | Armenia | 0.0 /100 | #330 | Tragic 92.3% |
| Hondurans | 0.0 /100 | #331 | Tragic 92.3% |
| Immigrants | Dominican Republic | 0.0 /100 | #332 | Tragic 92.3% |
| Hispanics or Latinos | 0.0 /100 | #333 | Tragic 92.2% |
| Immigrants | Yemen | 0.0 /100 | #334 | Tragic 92.1% |
| Mexican American Indians | 0.0 /100 | #335 | Tragic 92.1% |
| Immigrants | Honduras | 0.0 /100 | #336 | Tragic 91.9% |