Kenyan vs Slavic Single Father Households
COMPARE
Kenyan
Slavic
Single Father Households
Single Father Households Comparison
Kenyans
Slavs
2.4%
SINGLE FATHER HOUSEHOLDS
28.0/ 100
METRIC RATING
196th/ 347
METRIC RANK
2.2%
SINGLE FATHER HOUSEHOLDS
88.9/ 100
METRIC RATING
147th/ 347
METRIC RANK
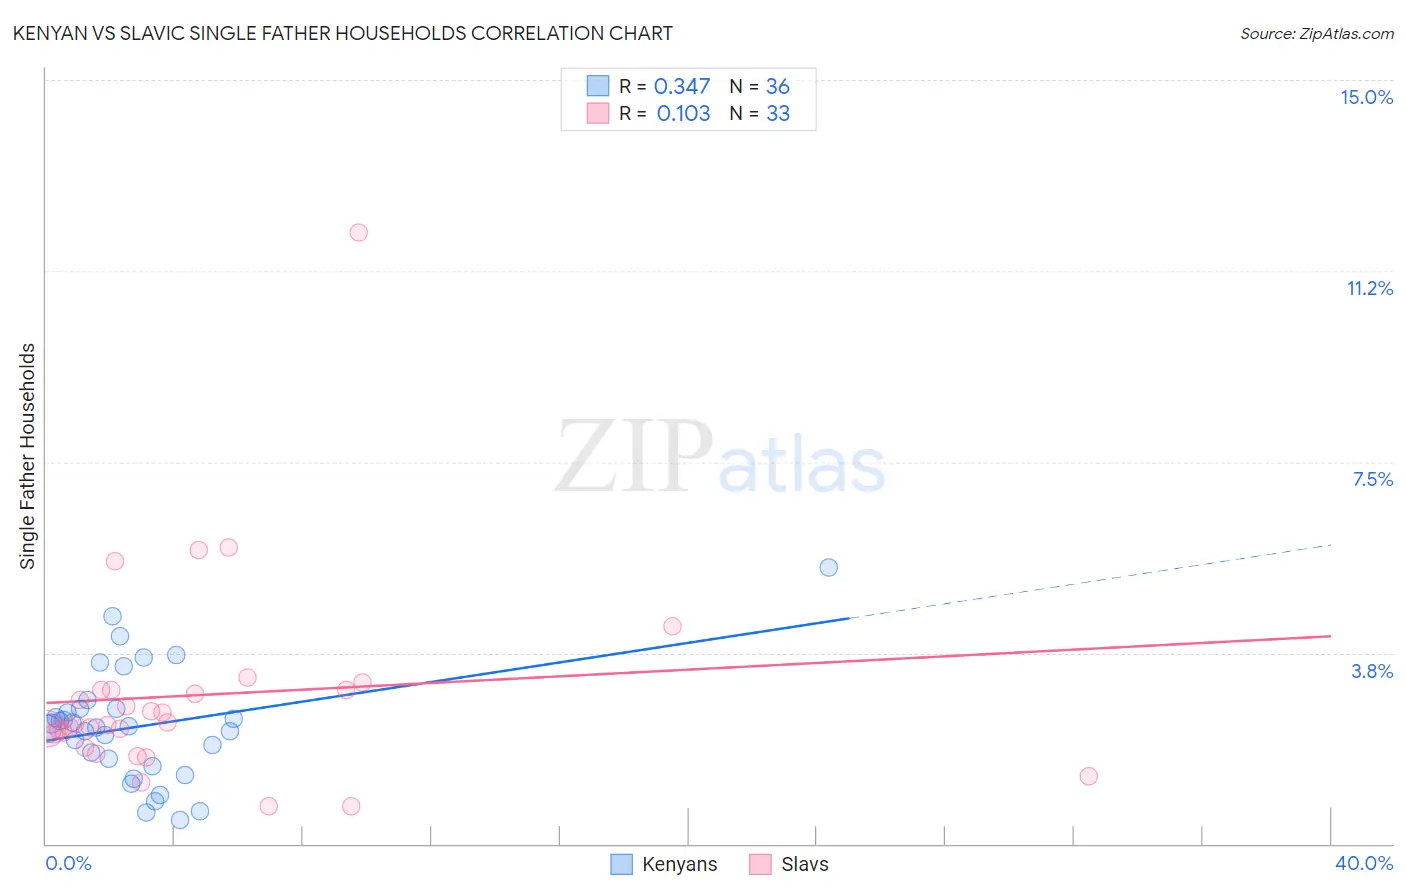
Kenyan vs Slavic Single Father Households Correlation Chart
The statistical analysis conducted on geographies consisting of 167,815,034 people shows a mild positive correlation between the proportion of Kenyans and percentage of single father households in the United States with a correlation coefficient (R) of 0.347 and weighted average of 2.4%. Similarly, the statistical analysis conducted on geographies consisting of 269,247,483 people shows a poor positive correlation between the proportion of Slavs and percentage of single father households in the United States with a correlation coefficient (R) of 0.103 and weighted average of 2.2%, a difference of 5.8%.
Single Father Households Correlation Summary
| Measurement | Kenyan | Slavic |
| Minimum | 0.47% | 0.74% |
| Maximum | 5.4% | 12.0% |
| Range | 5.0% | 11.3% |
| Mean | 2.3% | 2.9% |
| Median | 2.3% | 2.4% |
| Interquartile 25% (IQ1) | 1.6% | 2.0% |
| Interquartile 75% (IQ3) | 2.7% | 3.0% |
| Interquartile Range (IQR) | 1.1% | 1.0% |
| Standard Deviation (Sample) | 1.1% | 2.0% |
| Standard Deviation (Population) | 1.1% | 2.0% |
Similar Demographics by Single Father Households
Demographics Similar to Kenyans by Single Father Households
In terms of single father households, the demographic groups most similar to Kenyans are German (2.4%, a difference of 0.0%), Immigrants from Philippines (2.4%, a difference of 0.060%), Scandinavian (2.4%, a difference of 0.060%), Immigrants from Vietnam (2.4%, a difference of 0.080%), and Peruvian (2.4%, a difference of 0.090%).
| Demographics | Rating | Rank | Single Father Households |
| U.S. Virgin Islanders | 31.8 /100 | #189 | Fair 2.4% |
| French | 31.7 /100 | #190 | Fair 2.4% |
| Immigrants | Africa | 30.0 /100 | #191 | Fair 2.4% |
| Immigrants | Sudan | 29.8 /100 | #192 | Fair 2.4% |
| Uruguayans | 29.7 /100 | #193 | Fair 2.4% |
| Panamanians | 29.6 /100 | #194 | Fair 2.4% |
| Immigrants | Philippines | 28.7 /100 | #195 | Fair 2.4% |
| Kenyans | 28.0 /100 | #196 | Fair 2.4% |
| Germans | 28.0 /100 | #197 | Fair 2.4% |
| Scandinavians | 27.4 /100 | #198 | Fair 2.4% |
| Immigrants | Vietnam | 27.1 /100 | #199 | Fair 2.4% |
| Peruvians | 27.1 /100 | #200 | Fair 2.4% |
| Immigrants | Uganda | 26.0 /100 | #201 | Fair 2.4% |
| German Russians | 25.7 /100 | #202 | Fair 2.4% |
| French Canadians | 24.7 /100 | #203 | Fair 2.4% |
Demographics Similar to Slavs by Single Father Households
In terms of single father households, the demographic groups most similar to Slavs are South American Indian (2.3%, a difference of 0.090%), Senegalese (2.3%, a difference of 0.10%), Northern European (2.2%, a difference of 0.18%), Immigrants from Zimbabwe (2.2%, a difference of 0.26%), and Slovak (2.2%, a difference of 0.37%).
| Demographics | Rating | Rank | Single Father Households |
| British | 92.8 /100 | #140 | Exceptional 2.2% |
| Laotians | 92.5 /100 | #141 | Exceptional 2.2% |
| Luxembourgers | 92.3 /100 | #142 | Exceptional 2.2% |
| Immigrants | Nepal | 92.1 /100 | #143 | Exceptional 2.2% |
| Slovaks | 90.7 /100 | #144 | Exceptional 2.2% |
| Immigrants | Zimbabwe | 90.2 /100 | #145 | Exceptional 2.2% |
| Northern Europeans | 89.8 /100 | #146 | Excellent 2.2% |
| Slavs | 88.9 /100 | #147 | Excellent 2.2% |
| South American Indians | 88.5 /100 | #148 | Excellent 2.3% |
| Senegalese | 88.4 /100 | #149 | Excellent 2.3% |
| Venezuelans | 86.2 /100 | #150 | Excellent 2.3% |
| Immigrants | Syria | 84.8 /100 | #151 | Excellent 2.3% |
| Immigrants | Venezuela | 83.2 /100 | #152 | Excellent 2.3% |
| Immigrants | Germany | 82.8 /100 | #153 | Excellent 2.3% |
| Bolivians | 81.0 /100 | #154 | Excellent 2.3% |