Kenyan vs Arab Single Father Households
COMPARE
Kenyan
Arab
Single Father Households
Single Father Households Comparison
Kenyans
Arabs
2.4%
SINGLE FATHER HOUSEHOLDS
28.0/ 100
METRIC RATING
196th/ 347
METRIC RANK
2.1%
SINGLE FATHER HOUSEHOLDS
99.2/ 100
METRIC RATING
96th/ 347
METRIC RANK
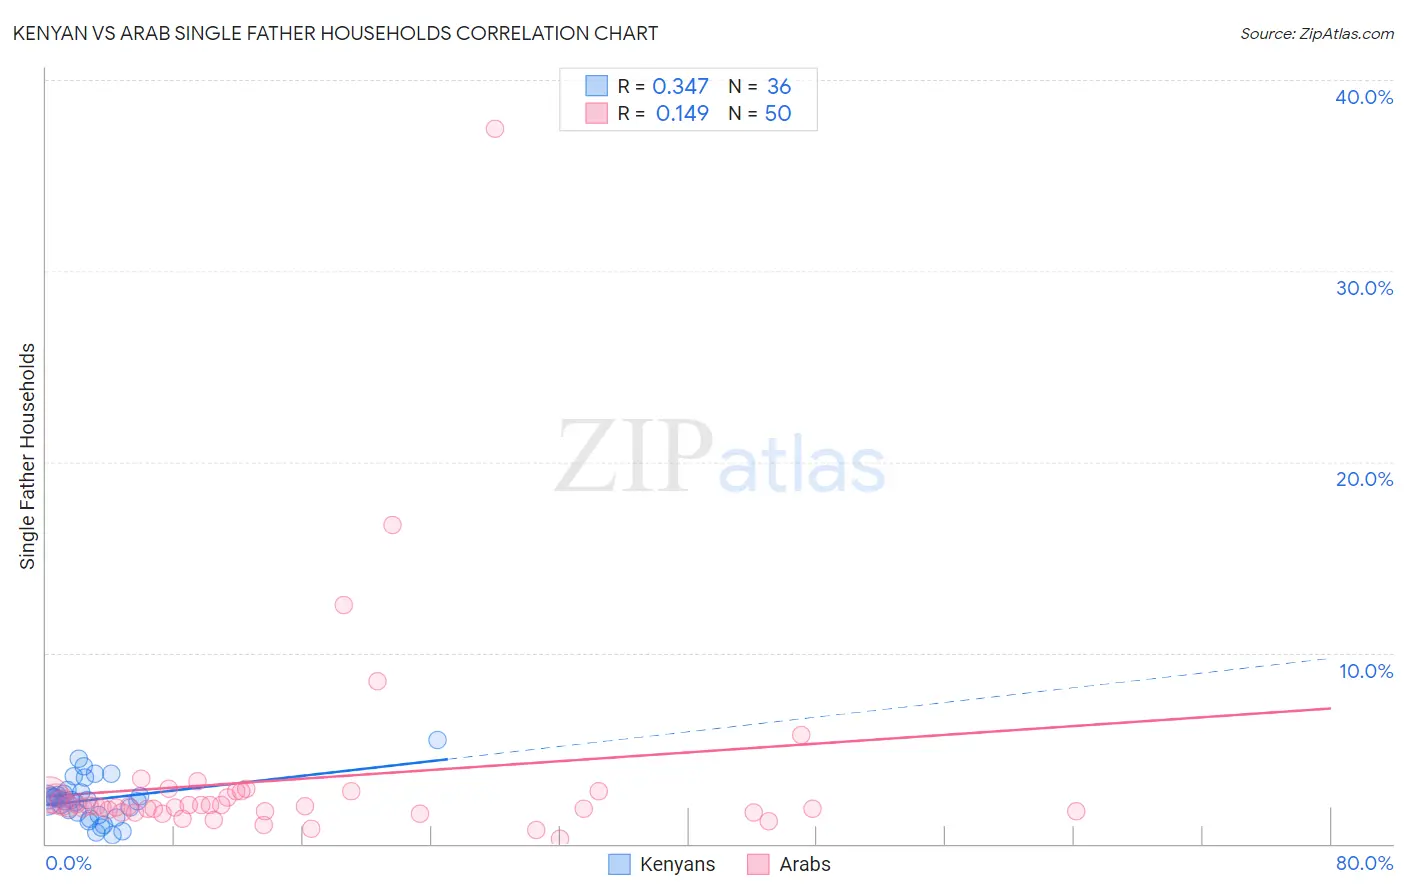
Kenyan vs Arab Single Father Households Correlation Chart
The statistical analysis conducted on geographies consisting of 167,815,034 people shows a mild positive correlation between the proportion of Kenyans and percentage of single father households in the United States with a correlation coefficient (R) of 0.347 and weighted average of 2.4%. Similarly, the statistical analysis conducted on geographies consisting of 480,579,440 people shows a poor positive correlation between the proportion of Arabs and percentage of single father households in the United States with a correlation coefficient (R) of 0.149 and weighted average of 2.1%, a difference of 11.6%.
Single Father Households Correlation Summary
| Measurement | Kenyan | Arab |
| Minimum | 0.47% | 0.25% |
| Maximum | 5.4% | 37.5% |
| Range | 5.0% | 37.2% |
| Mean | 2.3% | 3.4% |
| Median | 2.3% | 2.0% |
| Interquartile 25% (IQ1) | 1.6% | 1.7% |
| Interquartile 75% (IQ3) | 2.7% | 2.7% |
| Interquartile Range (IQR) | 1.1% | 1.0% |
| Standard Deviation (Sample) | 1.1% | 5.6% |
| Standard Deviation (Population) | 1.1% | 5.6% |
Similar Demographics by Single Father Households
Demographics Similar to Kenyans by Single Father Households
In terms of single father households, the demographic groups most similar to Kenyans are German (2.4%, a difference of 0.0%), Immigrants from Philippines (2.4%, a difference of 0.060%), Scandinavian (2.4%, a difference of 0.060%), Immigrants from Vietnam (2.4%, a difference of 0.080%), and Peruvian (2.4%, a difference of 0.090%).
| Demographics | Rating | Rank | Single Father Households |
| U.S. Virgin Islanders | 31.8 /100 | #189 | Fair 2.4% |
| French | 31.7 /100 | #190 | Fair 2.4% |
| Immigrants | Africa | 30.0 /100 | #191 | Fair 2.4% |
| Immigrants | Sudan | 29.8 /100 | #192 | Fair 2.4% |
| Uruguayans | 29.7 /100 | #193 | Fair 2.4% |
| Panamanians | 29.6 /100 | #194 | Fair 2.4% |
| Immigrants | Philippines | 28.7 /100 | #195 | Fair 2.4% |
| Kenyans | 28.0 /100 | #196 | Fair 2.4% |
| Germans | 28.0 /100 | #197 | Fair 2.4% |
| Scandinavians | 27.4 /100 | #198 | Fair 2.4% |
| Immigrants | Vietnam | 27.1 /100 | #199 | Fair 2.4% |
| Peruvians | 27.1 /100 | #200 | Fair 2.4% |
| Immigrants | Uganda | 26.0 /100 | #201 | Fair 2.4% |
| German Russians | 25.7 /100 | #202 | Fair 2.4% |
| French Canadians | 24.7 /100 | #203 | Fair 2.4% |
Demographics Similar to Arabs by Single Father Households
In terms of single father households, the demographic groups most similar to Arabs are Immigrants from Moldova (2.1%, a difference of 0.13%), Bermudan (2.1%, a difference of 0.14%), Guyanese (2.1%, a difference of 0.25%), South African (2.1%, a difference of 0.30%), and Croatian (2.1%, a difference of 0.37%).
| Demographics | Rating | Rank | Single Father Households |
| Immigrants | Armenia | 99.5 /100 | #89 | Exceptional 2.1% |
| Immigrants | Pakistan | 99.5 /100 | #90 | Exceptional 2.1% |
| Immigrants | Guyana | 99.4 /100 | #91 | Exceptional 2.1% |
| Romanians | 99.4 /100 | #92 | Exceptional 2.1% |
| Croatians | 99.3 /100 | #93 | Exceptional 2.1% |
| Ukrainians | 99.3 /100 | #94 | Exceptional 2.1% |
| Bermudans | 99.2 /100 | #95 | Exceptional 2.1% |
| Arabs | 99.2 /100 | #96 | Exceptional 2.1% |
| Immigrants | Moldova | 99.1 /100 | #97 | Exceptional 2.1% |
| Guyanese | 99.1 /100 | #98 | Exceptional 2.1% |
| South Africans | 99.1 /100 | #99 | Exceptional 2.1% |
| Immigrants | Northern Africa | 99.0 /100 | #100 | Exceptional 2.1% |
| Immigrants | Western Europe | 98.9 /100 | #101 | Exceptional 2.1% |
| Argentineans | 98.9 /100 | #102 | Exceptional 2.1% |
| Lebanese | 98.9 /100 | #103 | Exceptional 2.1% |