Kenyan vs Immigrants from Portugal Single Father Households
COMPARE
Kenyan
Immigrants from Portugal
Single Father Households
Single Father Households Comparison
Kenyans
Immigrants from Portugal
2.4%
SINGLE FATHER HOUSEHOLDS
28.0/ 100
METRIC RATING
196th/ 347
METRIC RANK
2.6%
SINGLE FATHER HOUSEHOLDS
0.1/ 100
METRIC RATING
280th/ 347
METRIC RANK
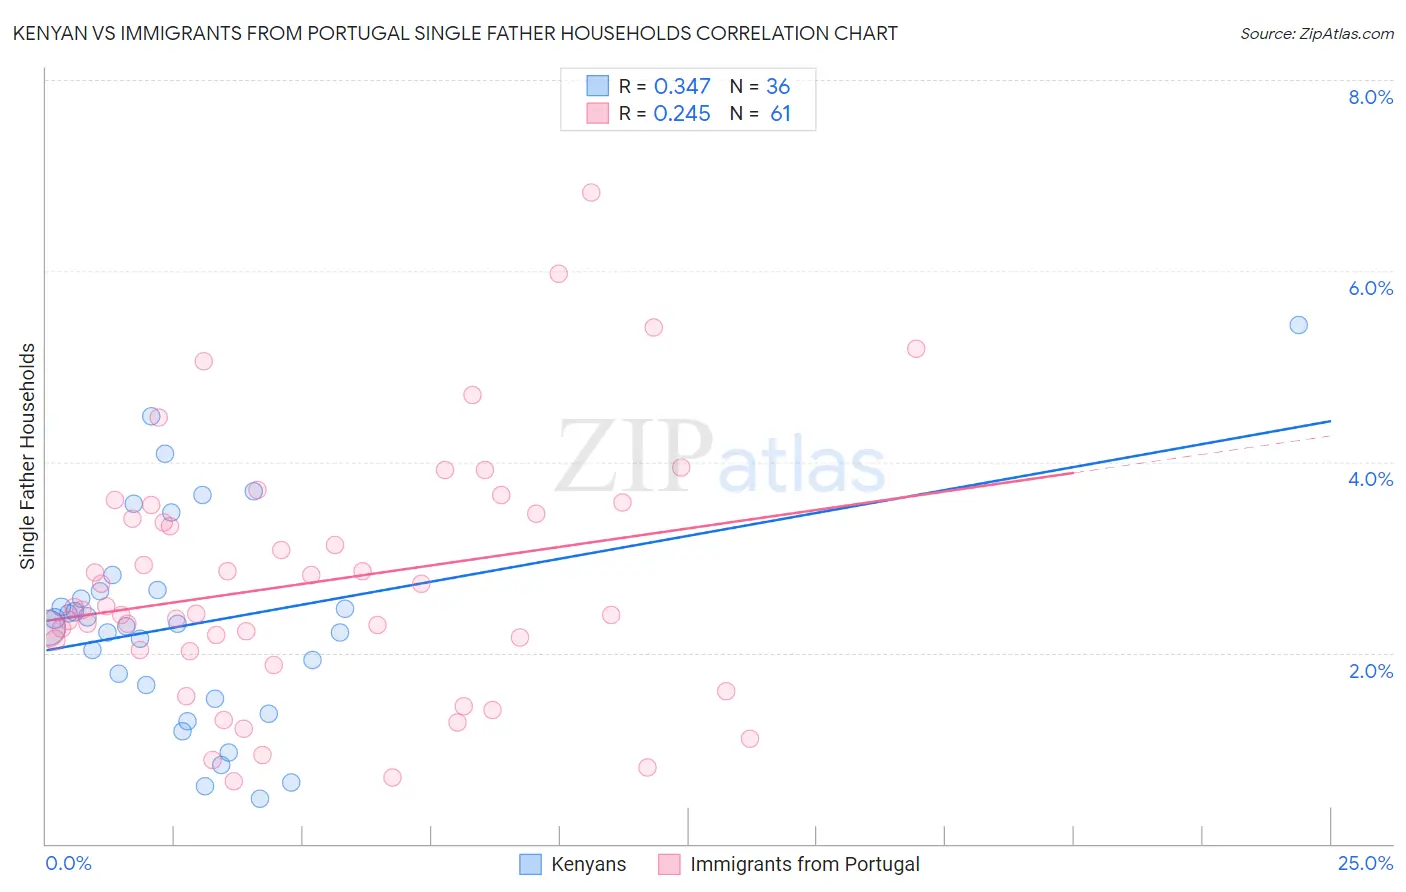
Kenyan vs Immigrants from Portugal Single Father Households Correlation Chart
The statistical analysis conducted on geographies consisting of 167,815,034 people shows a mild positive correlation between the proportion of Kenyans and percentage of single father households in the United States with a correlation coefficient (R) of 0.347 and weighted average of 2.4%. Similarly, the statistical analysis conducted on geographies consisting of 173,713,096 people shows a weak positive correlation between the proportion of Immigrants from Portugal and percentage of single father households in the United States with a correlation coefficient (R) of 0.245 and weighted average of 2.6%, a difference of 10.9%.
Single Father Households Correlation Summary
| Measurement | Kenyan | Immigrants from Portugal |
| Minimum | 0.47% | 0.66% |
| Maximum | 5.4% | 6.8% |
| Range | 5.0% | 6.2% |
| Mean | 2.3% | 2.7% |
| Median | 2.3% | 2.5% |
| Interquartile 25% (IQ1) | 1.6% | 2.0% |
| Interquartile 75% (IQ3) | 2.7% | 3.5% |
| Interquartile Range (IQR) | 1.1% | 1.5% |
| Standard Deviation (Sample) | 1.1% | 1.3% |
| Standard Deviation (Population) | 1.1% | 1.3% |
Similar Demographics by Single Father Households
Demographics Similar to Kenyans by Single Father Households
In terms of single father households, the demographic groups most similar to Kenyans are German (2.4%, a difference of 0.0%), Immigrants from Philippines (2.4%, a difference of 0.060%), Scandinavian (2.4%, a difference of 0.060%), Immigrants from Vietnam (2.4%, a difference of 0.080%), and Peruvian (2.4%, a difference of 0.090%).
| Demographics | Rating | Rank | Single Father Households |
| U.S. Virgin Islanders | 31.8 /100 | #189 | Fair 2.4% |
| French | 31.7 /100 | #190 | Fair 2.4% |
| Immigrants | Africa | 30.0 /100 | #191 | Fair 2.4% |
| Immigrants | Sudan | 29.8 /100 | #192 | Fair 2.4% |
| Uruguayans | 29.7 /100 | #193 | Fair 2.4% |
| Panamanians | 29.6 /100 | #194 | Fair 2.4% |
| Immigrants | Philippines | 28.7 /100 | #195 | Fair 2.4% |
| Kenyans | 28.0 /100 | #196 | Fair 2.4% |
| Germans | 28.0 /100 | #197 | Fair 2.4% |
| Scandinavians | 27.4 /100 | #198 | Fair 2.4% |
| Immigrants | Vietnam | 27.1 /100 | #199 | Fair 2.4% |
| Peruvians | 27.1 /100 | #200 | Fair 2.4% |
| Immigrants | Uganda | 26.0 /100 | #201 | Fair 2.4% |
| German Russians | 25.7 /100 | #202 | Fair 2.4% |
| French Canadians | 24.7 /100 | #203 | Fair 2.4% |
Demographics Similar to Immigrants from Portugal by Single Father Households
In terms of single father households, the demographic groups most similar to Immigrants from Portugal are Nicaraguan (2.6%, a difference of 0.010%), Dutch West Indian (2.6%, a difference of 0.060%), Samoan (2.6%, a difference of 0.55%), Cherokee (2.6%, a difference of 0.59%), and Shoshone (2.6%, a difference of 0.64%).
| Demographics | Rating | Rank | Single Father Households |
| Iroquois | 0.2 /100 | #273 | Tragic 2.6% |
| Puerto Ricans | 0.2 /100 | #274 | Tragic 2.6% |
| Immigrants | Dominican Republic | 0.2 /100 | #275 | Tragic 2.6% |
| Immigrants | Haiti | 0.1 /100 | #276 | Tragic 2.6% |
| Shoshone | 0.1 /100 | #277 | Tragic 2.6% |
| Cherokee | 0.1 /100 | #278 | Tragic 2.6% |
| Samoans | 0.1 /100 | #279 | Tragic 2.6% |
| Immigrants | Portugal | 0.1 /100 | #280 | Tragic 2.6% |
| Nicaraguans | 0.1 /100 | #281 | Tragic 2.6% |
| Dutch West Indians | 0.1 /100 | #282 | Tragic 2.6% |
| Immigrants | Nicaragua | 0.1 /100 | #283 | Tragic 2.7% |
| Hawaiians | 0.1 /100 | #284 | Tragic 2.7% |
| Ottawa | 0.1 /100 | #285 | Tragic 2.7% |
| Immigrants | Cuba | 0.1 /100 | #286 | Tragic 2.7% |
| Central American Indians | 0.0 /100 | #287 | Tragic 2.7% |