Japanese vs Immigrants from Latin America Family Households
COMPARE
Japanese
Immigrants from Latin America
Family Households
Family Households Comparison
Japanese
Immigrants from Latin America
65.9%
FAMILY HOUSEHOLDS
99.9/ 100
METRIC RATING
68th/ 347
METRIC RANK
67.2%
FAMILY HOUSEHOLDS
100.0/ 100
METRIC RATING
31st/ 347
METRIC RANK
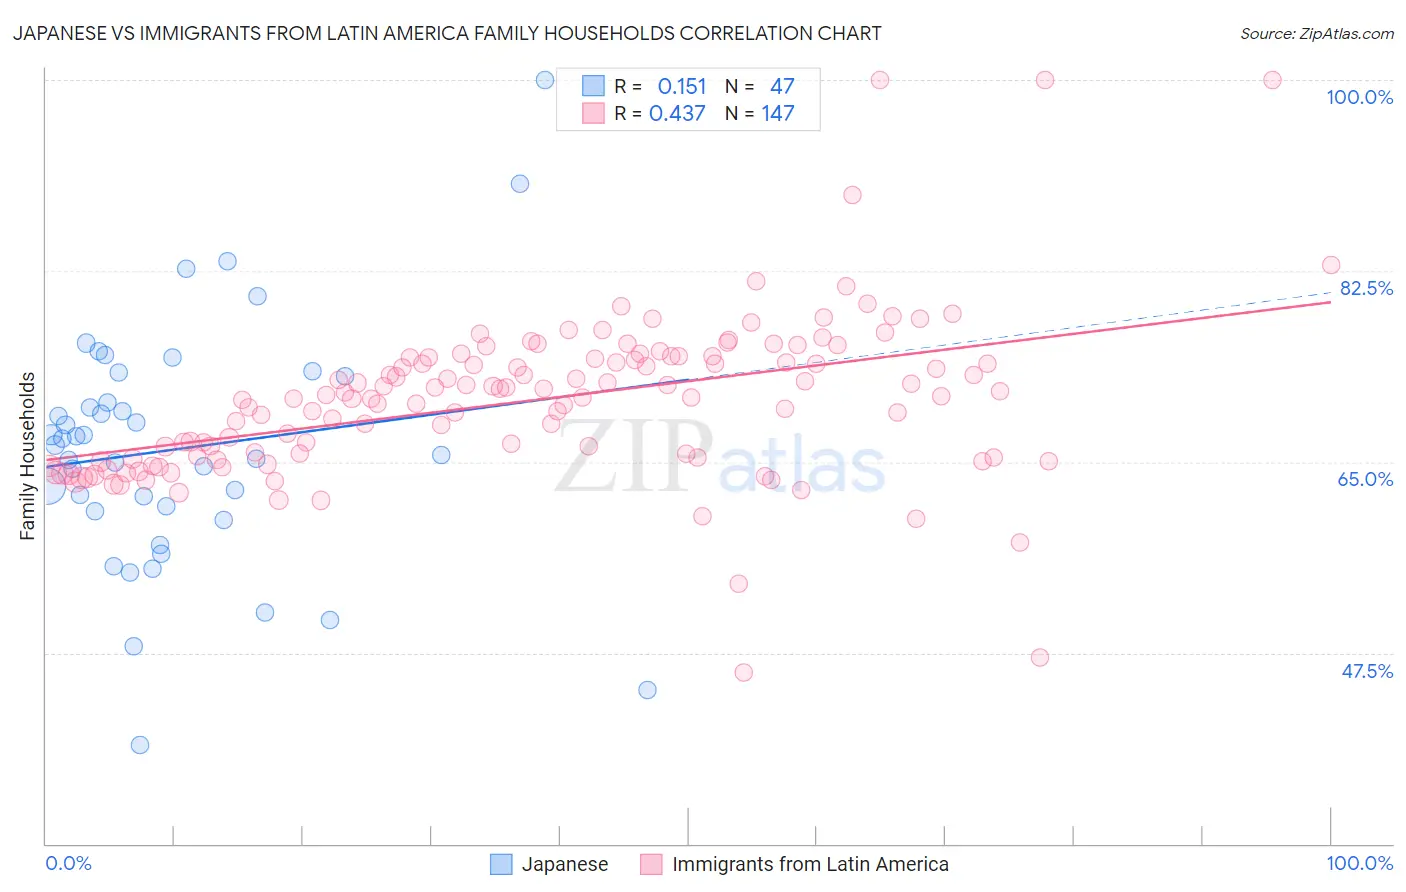
Japanese vs Immigrants from Latin America Family Households Correlation Chart
The statistical analysis conducted on geographies consisting of 249,074,128 people shows a poor positive correlation between the proportion of Japanese and percentage of family households in the United States with a correlation coefficient (R) of 0.151 and weighted average of 65.9%. Similarly, the statistical analysis conducted on geographies consisting of 558,036,504 people shows a moderate positive correlation between the proportion of Immigrants from Latin America and percentage of family households in the United States with a correlation coefficient (R) of 0.437 and weighted average of 67.2%, a difference of 2.0%.
Family Households Correlation Summary
| Measurement | Japanese | Immigrants from Latin America |
| Minimum | 39.1% | 45.7% |
| Maximum | 100.0% | 100.0% |
| Range | 60.9% | 54.3% |
| Mean | 66.2% | 70.6% |
| Median | 66.6% | 70.9% |
| Interquartile 25% (IQ1) | 60.5% | 65.3% |
| Interquartile 75% (IQ3) | 72.9% | 74.5% |
| Interquartile Range (IQR) | 12.4% | 9.3% |
| Standard Deviation (Sample) | 11.2% | 7.5% |
| Standard Deviation (Population) | 11.1% | 7.5% |
Similar Demographics by Family Households
Demographics Similar to Japanese by Family Households
In terms of family households, the demographic groups most similar to Japanese are Fijian (65.9%, a difference of 0.020%), Filipino (65.9%, a difference of 0.020%), Malaysian (65.9%, a difference of 0.030%), Immigrants from Afghanistan (65.9%, a difference of 0.040%), and Costa Rican (65.9%, a difference of 0.060%).
| Demographics | Rating | Rank | Family Households |
| Danes | 100.0 /100 | #61 | Exceptional 66.0% |
| Central Americans | 100.0 /100 | #62 | Exceptional 66.0% |
| Immigrants | Indonesia | 100.0 /100 | #63 | Exceptional 66.0% |
| Pima | 99.9 /100 | #64 | Exceptional 65.9% |
| Costa Ricans | 99.9 /100 | #65 | Exceptional 65.9% |
| Fijians | 99.9 /100 | #66 | Exceptional 65.9% |
| Filipinos | 99.9 /100 | #67 | Exceptional 65.9% |
| Japanese | 99.9 /100 | #68 | Exceptional 65.9% |
| Malaysians | 99.9 /100 | #69 | Exceptional 65.9% |
| Immigrants | Afghanistan | 99.9 /100 | #70 | Exceptional 65.9% |
| Bhutanese | 99.9 /100 | #71 | Exceptional 65.9% |
| Portuguese | 99.9 /100 | #72 | Exceptional 65.8% |
| Laotians | 99.9 /100 | #73 | Exceptional 65.8% |
| Burmese | 99.9 /100 | #74 | Exceptional 65.7% |
| Houma | 99.9 /100 | #75 | Exceptional 65.7% |
Demographics Similar to Immigrants from Latin America by Family Households
In terms of family households, the demographic groups most similar to Immigrants from Latin America are Immigrants from Peru (67.2%, a difference of 0.010%), Nepalese (67.2%, a difference of 0.060%), Salvadoran (67.2%, a difference of 0.10%), Thai (67.2%, a difference of 0.10%), and Tohono O'odham (67.1%, a difference of 0.15%).
| Demographics | Rating | Rank | Family Households |
| Immigrants | South Eastern Asia | 100.0 /100 | #24 | Exceptional 67.5% |
| Immigrants | Nicaragua | 100.0 /100 | #25 | Exceptional 67.5% |
| Immigrants | India | 100.0 /100 | #26 | Exceptional 67.4% |
| Hispanics or Latinos | 100.0 /100 | #27 | Exceptional 67.4% |
| Hawaiians | 100.0 /100 | #28 | Exceptional 67.4% |
| Nicaraguans | 100.0 /100 | #29 | Exceptional 67.4% |
| Immigrants | Peru | 100.0 /100 | #30 | Exceptional 67.2% |
| Immigrants | Latin America | 100.0 /100 | #31 | Exceptional 67.2% |
| Nepalese | 100.0 /100 | #32 | Exceptional 67.2% |
| Salvadorans | 100.0 /100 | #33 | Exceptional 67.2% |
| Thais | 100.0 /100 | #34 | Exceptional 67.2% |
| Tohono O'odham | 100.0 /100 | #35 | Exceptional 67.1% |
| Peruvians | 100.0 /100 | #36 | Exceptional 67.1% |
| Tsimshian | 100.0 /100 | #37 | Exceptional 67.1% |
| Mexican American Indians | 100.0 /100 | #38 | Exceptional 67.0% |