Japanese vs British West Indian 12th Grade, No Diploma
COMPARE
Japanese
British West Indian
12th Grade, No Diploma
12th Grade, No Diploma Comparison
Japanese
British West Indians
88.3%
12TH GRADE, NO DIPLOMA
0.0/ 100
METRIC RATING
293rd/ 347
METRIC RANK
88.5%
12TH GRADE, NO DIPLOMA
0.0/ 100
METRIC RATING
290th/ 347
METRIC RANK
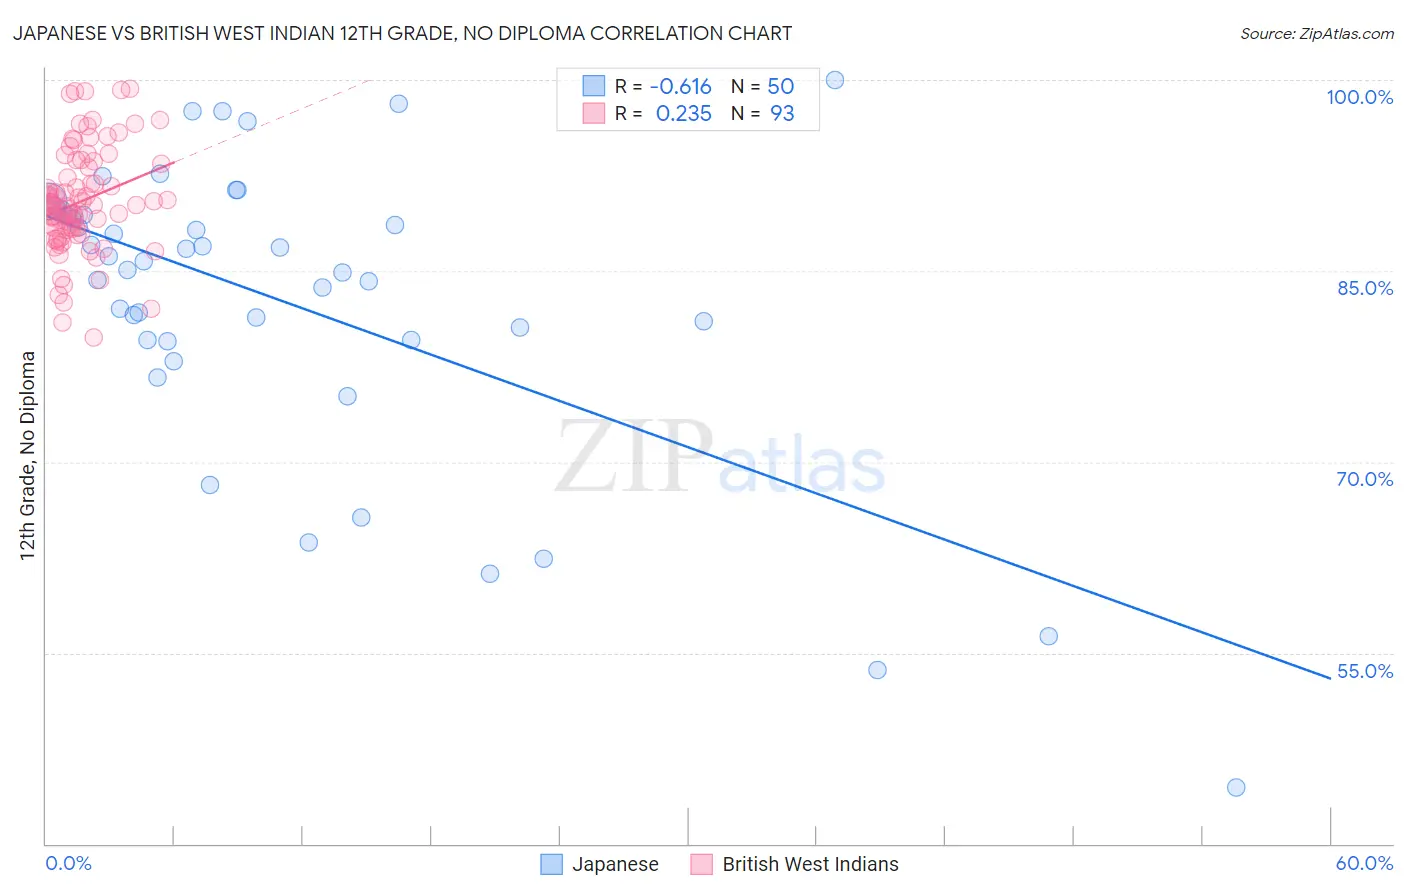
Japanese vs British West Indian 12th Grade, No Diploma Correlation Chart
The statistical analysis conducted on geographies consisting of 249,183,224 people shows a significant negative correlation between the proportion of Japanese and percentage of population with at least 12th grade (no diploma) education in the United States with a correlation coefficient (R) of -0.616 and weighted average of 88.3%. Similarly, the statistical analysis conducted on geographies consisting of 152,698,597 people shows a weak positive correlation between the proportion of British West Indians and percentage of population with at least 12th grade (no diploma) education in the United States with a correlation coefficient (R) of 0.235 and weighted average of 88.5%, a difference of 0.26%.
12th Grade, No Diploma Correlation Summary
| Measurement | Japanese | British West Indian |
| Minimum | 44.4% | 79.8% |
| Maximum | 100.0% | 99.4% |
| Range | 55.6% | 19.6% |
| Mean | 82.5% | 90.5% |
| Median | 85.4% | 90.1% |
| Interquartile 25% (IQ1) | 79.6% | 88.3% |
| Interquartile 75% (IQ3) | 89.4% | 93.3% |
| Interquartile Range (IQR) | 9.8% | 5.0% |
| Standard Deviation (Sample) | 11.9% | 4.1% |
| Standard Deviation (Population) | 11.8% | 4.1% |
Demographics Similar to Japanese and British West Indians by 12th Grade, No Diploma
In terms of 12th grade, no diploma, the demographic groups most similar to Japanese are Guyanese (88.3%, a difference of 0.070%), Immigrants from Grenada (88.4%, a difference of 0.090%), Immigrants (88.2%, a difference of 0.11%), Fijian (88.2%, a difference of 0.13%), and Pueblo (88.2%, a difference of 0.14%). Similarly, the demographic groups most similar to British West Indians are Dutch West Indian (88.5%, a difference of 0.0%), Haitian (88.5%, a difference of 0.0%), Immigrants from Fiji (88.6%, a difference of 0.10%), Hopi (88.6%, a difference of 0.11%), and Indonesian (88.6%, a difference of 0.12%).
| Demographics | Rating | Rank | 12th Grade, No Diploma |
| Cubans | 0.0 /100 | #281 | Tragic 88.9% |
| Immigrants | Vietnam | 0.0 /100 | #282 | Tragic 88.7% |
| Paiute | 0.0 /100 | #283 | Tragic 88.7% |
| Pennsylvania Germans | 0.0 /100 | #284 | Tragic 88.7% |
| Indonesians | 0.0 /100 | #285 | Tragic 88.6% |
| Immigrants | West Indies | 0.0 /100 | #286 | Tragic 88.6% |
| Hopi | 0.0 /100 | #287 | Tragic 88.6% |
| Immigrants | Fiji | 0.0 /100 | #288 | Tragic 88.6% |
| Dutch West Indians | 0.0 /100 | #289 | Tragic 88.5% |
| British West Indians | 0.0 /100 | #290 | Tragic 88.5% |
| Haitians | 0.0 /100 | #291 | Tragic 88.5% |
| Immigrants | Grenada | 0.0 /100 | #292 | Tragic 88.4% |
| Japanese | 0.0 /100 | #293 | Tragic 88.3% |
| Guyanese | 0.0 /100 | #294 | Tragic 88.3% |
| Immigrants | Immigrants | 0.0 /100 | #295 | Tragic 88.2% |
| Fijians | 0.0 /100 | #296 | Tragic 88.2% |
| Pueblo | 0.0 /100 | #297 | Tragic 88.2% |
| Immigrants | Haiti | 0.0 /100 | #298 | Tragic 88.2% |
| Nepalese | 0.0 /100 | #299 | Tragic 88.1% |
| Immigrants | Guyana | 0.0 /100 | #300 | Tragic 88.1% |
| Immigrants | Cambodia | 0.0 /100 | #301 | Tragic 88.1% |