Jamaican vs Immigrants from Uganda Single Father Households
COMPARE
Jamaican
Immigrants from Uganda
Single Father Households
Single Father Households Comparison
Jamaicans
Immigrants from Uganda
2.3%
SINGLE FATHER HOUSEHOLDS
43.5/ 100
METRIC RATING
181st/ 347
METRIC RANK
2.4%
SINGLE FATHER HOUSEHOLDS
26.0/ 100
METRIC RATING
201st/ 347
METRIC RANK
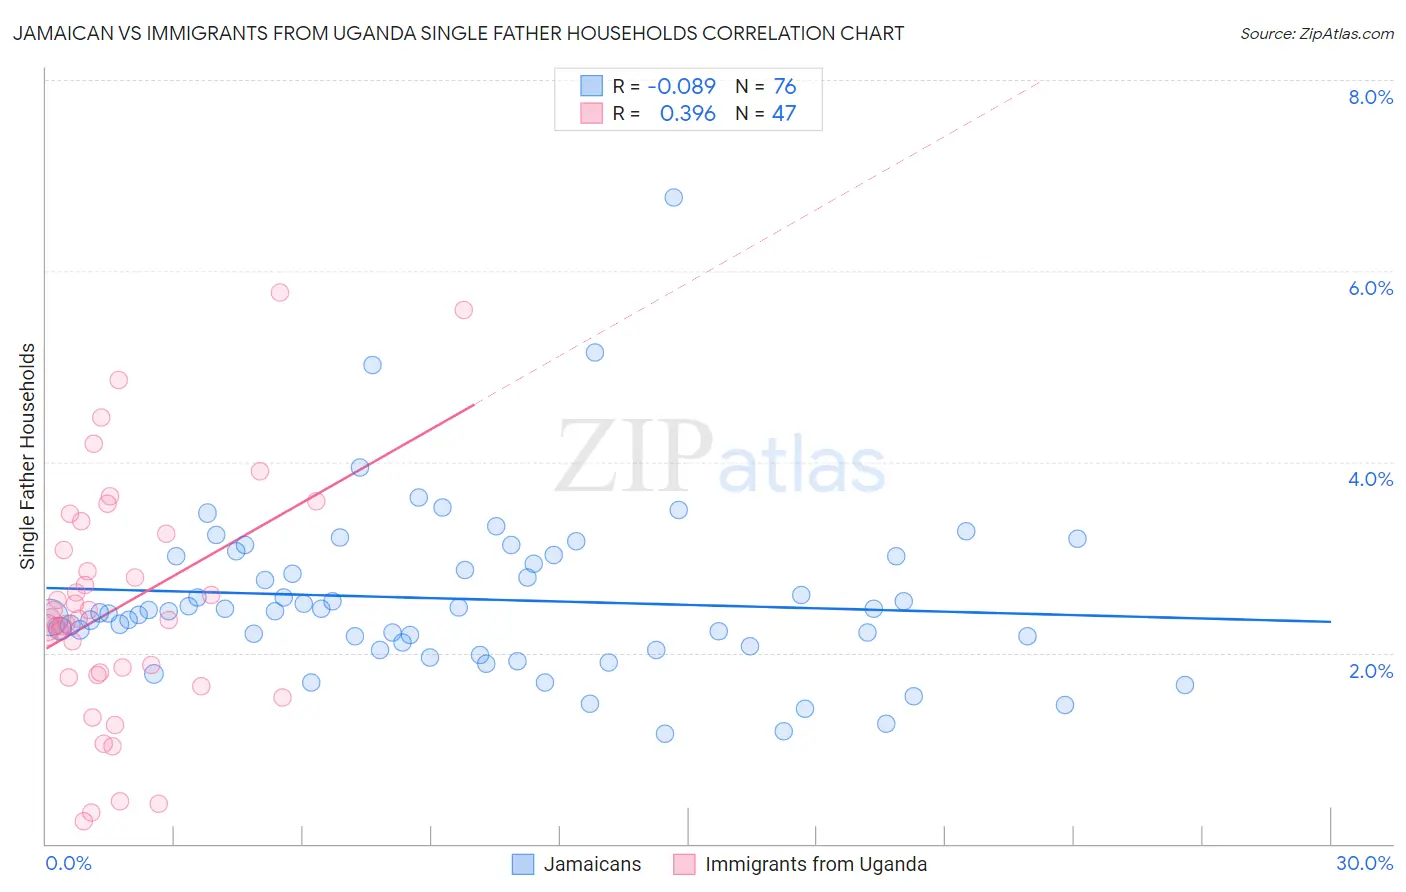
Jamaican vs Immigrants from Uganda Single Father Households Correlation Chart
The statistical analysis conducted on geographies consisting of 365,117,858 people shows a slight negative correlation between the proportion of Jamaicans and percentage of single father households in the United States with a correlation coefficient (R) of -0.089 and weighted average of 2.3%. Similarly, the statistical analysis conducted on geographies consisting of 125,685,639 people shows a mild positive correlation between the proportion of Immigrants from Uganda and percentage of single father households in the United States with a correlation coefficient (R) of 0.396 and weighted average of 2.4%, a difference of 1.4%.
Single Father Households Correlation Summary
| Measurement | Jamaican | Immigrants from Uganda |
| Minimum | 1.2% | 0.24% |
| Maximum | 6.8% | 5.8% |
| Range | 5.6% | 5.5% |
| Mean | 2.6% | 2.5% |
| Median | 2.4% | 2.4% |
| Interquartile 25% (IQ1) | 2.1% | 1.8% |
| Interquartile 75% (IQ3) | 3.0% | 3.2% |
| Interquartile Range (IQR) | 0.92% | 1.5% |
| Standard Deviation (Sample) | 0.88% | 1.2% |
| Standard Deviation (Population) | 0.88% | 1.2% |
Demographics Similar to Jamaicans and Immigrants from Uganda by Single Father Households
In terms of single father households, the demographic groups most similar to Jamaicans are Belgian (2.3%, a difference of 0.020%), Immigrants from Panama (2.4%, a difference of 0.12%), Sri Lankan (2.4%, a difference of 0.13%), Nigerian (2.4%, a difference of 0.18%), and Immigrants from Bosnia and Herzegovina (2.4%, a difference of 0.23%). Similarly, the demographic groups most similar to Immigrants from Uganda are Immigrants from Vietnam (2.4%, a difference of 0.10%), Peruvian (2.4%, a difference of 0.10%), Scandinavian (2.4%, a difference of 0.13%), German (2.4%, a difference of 0.18%), and Kenyan (2.4%, a difference of 0.19%).
| Demographics | Rating | Rank | Single Father Households |
| Jamaicans | 43.5 /100 | #181 | Average 2.3% |
| Belgians | 43.3 /100 | #182 | Average 2.3% |
| Immigrants | Panama | 41.8 /100 | #183 | Average 2.4% |
| Sri Lankans | 41.8 /100 | #184 | Average 2.4% |
| Nigerians | 41.0 /100 | #185 | Average 2.4% |
| Immigrants | Bosnia and Herzegovina | 40.4 /100 | #186 | Average 2.4% |
| Immigrants | Colombia | 34.0 /100 | #187 | Fair 2.4% |
| Hmong | 33.0 /100 | #188 | Fair 2.4% |
| U.S. Virgin Islanders | 31.8 /100 | #189 | Fair 2.4% |
| French | 31.7 /100 | #190 | Fair 2.4% |
| Immigrants | Africa | 30.0 /100 | #191 | Fair 2.4% |
| Immigrants | Sudan | 29.8 /100 | #192 | Fair 2.4% |
| Uruguayans | 29.7 /100 | #193 | Fair 2.4% |
| Panamanians | 29.6 /100 | #194 | Fair 2.4% |
| Immigrants | Philippines | 28.7 /100 | #195 | Fair 2.4% |
| Kenyans | 28.0 /100 | #196 | Fair 2.4% |
| Germans | 28.0 /100 | #197 | Fair 2.4% |
| Scandinavians | 27.4 /100 | #198 | Fair 2.4% |
| Immigrants | Vietnam | 27.1 /100 | #199 | Fair 2.4% |
| Peruvians | 27.1 /100 | #200 | Fair 2.4% |
| Immigrants | Uganda | 26.0 /100 | #201 | Fair 2.4% |