Jamaican vs Spanish Single Father Households
COMPARE
Jamaican
Spanish
Single Father Households
Single Father Households Comparison
Jamaicans
Spanish
2.3%
SINGLE FATHER HOUSEHOLDS
43.5/ 100
METRIC RATING
181st/ 347
METRIC RANK
2.5%
SINGLE FATHER HOUSEHOLDS
1.1/ 100
METRIC RATING
258th/ 347
METRIC RANK
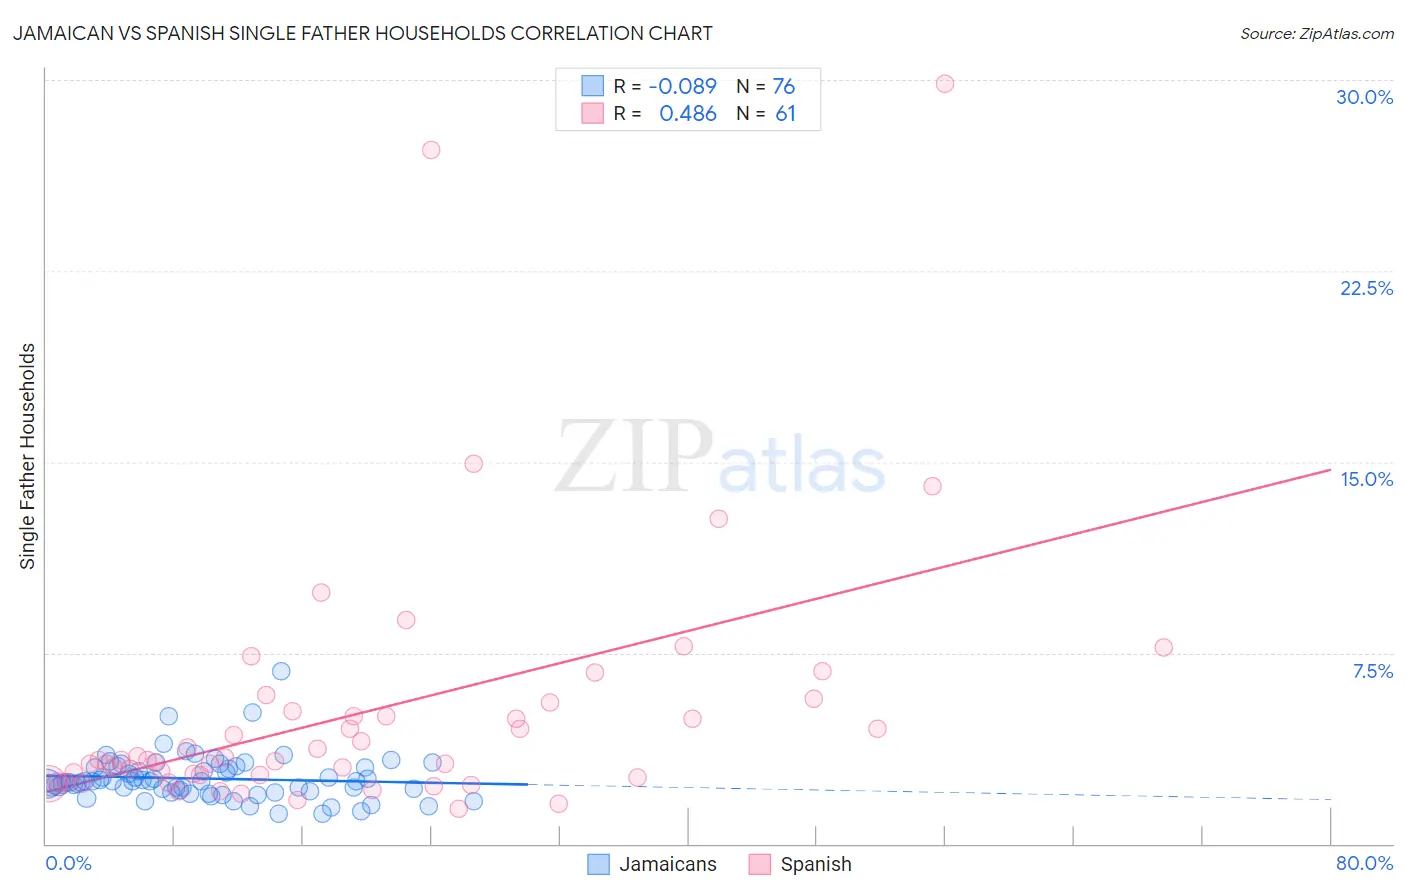
Jamaican vs Spanish Single Father Households Correlation Chart
The statistical analysis conducted on geographies consisting of 365,117,858 people shows a slight negative correlation between the proportion of Jamaicans and percentage of single father households in the United States with a correlation coefficient (R) of -0.089 and weighted average of 2.3%. Similarly, the statistical analysis conducted on geographies consisting of 418,035,178 people shows a moderate positive correlation between the proportion of Spanish and percentage of single father households in the United States with a correlation coefficient (R) of 0.486 and weighted average of 2.5%, a difference of 7.7%.
Single Father Households Correlation Summary
| Measurement | Jamaican | Spanish |
| Minimum | 1.2% | 1.4% |
| Maximum | 6.8% | 29.9% |
| Range | 5.6% | 28.5% |
| Mean | 2.6% | 5.2% |
| Median | 2.4% | 3.3% |
| Interquartile 25% (IQ1) | 2.1% | 2.6% |
| Interquartile 75% (IQ3) | 3.0% | 5.4% |
| Interquartile Range (IQR) | 0.92% | 2.7% |
| Standard Deviation (Sample) | 0.88% | 5.2% |
| Standard Deviation (Population) | 0.88% | 5.2% |
Similar Demographics by Single Father Households
Demographics Similar to Jamaicans by Single Father Households
In terms of single father households, the demographic groups most similar to Jamaicans are Belgian (2.3%, a difference of 0.020%), Yugoslavian (2.3%, a difference of 0.030%), Costa Rican (2.3%, a difference of 0.040%), Welsh (2.3%, a difference of 0.040%), and Immigrants from Panama (2.4%, a difference of 0.12%).
| Demographics | Rating | Rank | Single Father Households |
| Afghans | 50.0 /100 | #174 | Average 2.3% |
| Immigrants | Jamaica | 49.1 /100 | #175 | Average 2.3% |
| Danes | 48.2 /100 | #176 | Average 2.3% |
| Colombians | 48.0 /100 | #177 | Average 2.3% |
| Costa Ricans | 44.1 /100 | #178 | Average 2.3% |
| Welsh | 44.0 /100 | #179 | Average 2.3% |
| Yugoslavians | 43.9 /100 | #180 | Average 2.3% |
| Jamaicans | 43.5 /100 | #181 | Average 2.3% |
| Belgians | 43.3 /100 | #182 | Average 2.3% |
| Immigrants | Panama | 41.8 /100 | #183 | Average 2.4% |
| Sri Lankans | 41.8 /100 | #184 | Average 2.4% |
| Nigerians | 41.0 /100 | #185 | Average 2.4% |
| Immigrants | Bosnia and Herzegovina | 40.4 /100 | #186 | Average 2.4% |
| Immigrants | Colombia | 34.0 /100 | #187 | Fair 2.4% |
| Hmong | 33.0 /100 | #188 | Fair 2.4% |
Demographics Similar to Spanish by Single Father Households
In terms of single father households, the demographic groups most similar to Spanish are Immigrants from Congo (2.5%, a difference of 0.090%), Comanche (2.5%, a difference of 0.16%), Immigrants from Caribbean (2.5%, a difference of 0.24%), Potawatomi (2.5%, a difference of 0.37%), and Immigrants from Belize (2.5%, a difference of 0.40%).
| Demographics | Rating | Rank | Single Father Households |
| Liberians | 2.0 /100 | #251 | Tragic 2.5% |
| Immigrants | Eritrea | 2.0 /100 | #252 | Tragic 2.5% |
| Immigrants | Somalia | 1.9 /100 | #253 | Tragic 2.5% |
| Immigrants | Thailand | 1.8 /100 | #254 | Tragic 2.5% |
| Tongans | 1.5 /100 | #255 | Tragic 2.5% |
| Potawatomi | 1.4 /100 | #256 | Tragic 2.5% |
| Immigrants | Congo | 1.2 /100 | #257 | Tragic 2.5% |
| Spanish | 1.1 /100 | #258 | Tragic 2.5% |
| Comanche | 1.0 /100 | #259 | Tragic 2.5% |
| Immigrants | Caribbean | 1.0 /100 | #260 | Tragic 2.5% |
| Immigrants | Belize | 0.9 /100 | #261 | Tragic 2.5% |
| Immigrants | Liberia | 0.8 /100 | #262 | Tragic 2.5% |
| Dominicans | 0.8 /100 | #263 | Tragic 2.5% |
| Indonesians | 0.5 /100 | #264 | Tragic 2.6% |
| Immigrants | Micronesia | 0.5 /100 | #265 | Tragic 2.6% |