Jamaican vs Immigrants from Afghanistan Single Father Households
COMPARE
Jamaican
Immigrants from Afghanistan
Single Father Households
Single Father Households Comparison
Jamaicans
Immigrants from Afghanistan
2.3%
SINGLE FATHER HOUSEHOLDS
43.5/ 100
METRIC RATING
181st/ 347
METRIC RANK
2.4%
SINGLE FATHER HOUSEHOLDS
24.2/ 100
METRIC RATING
205th/ 347
METRIC RANK
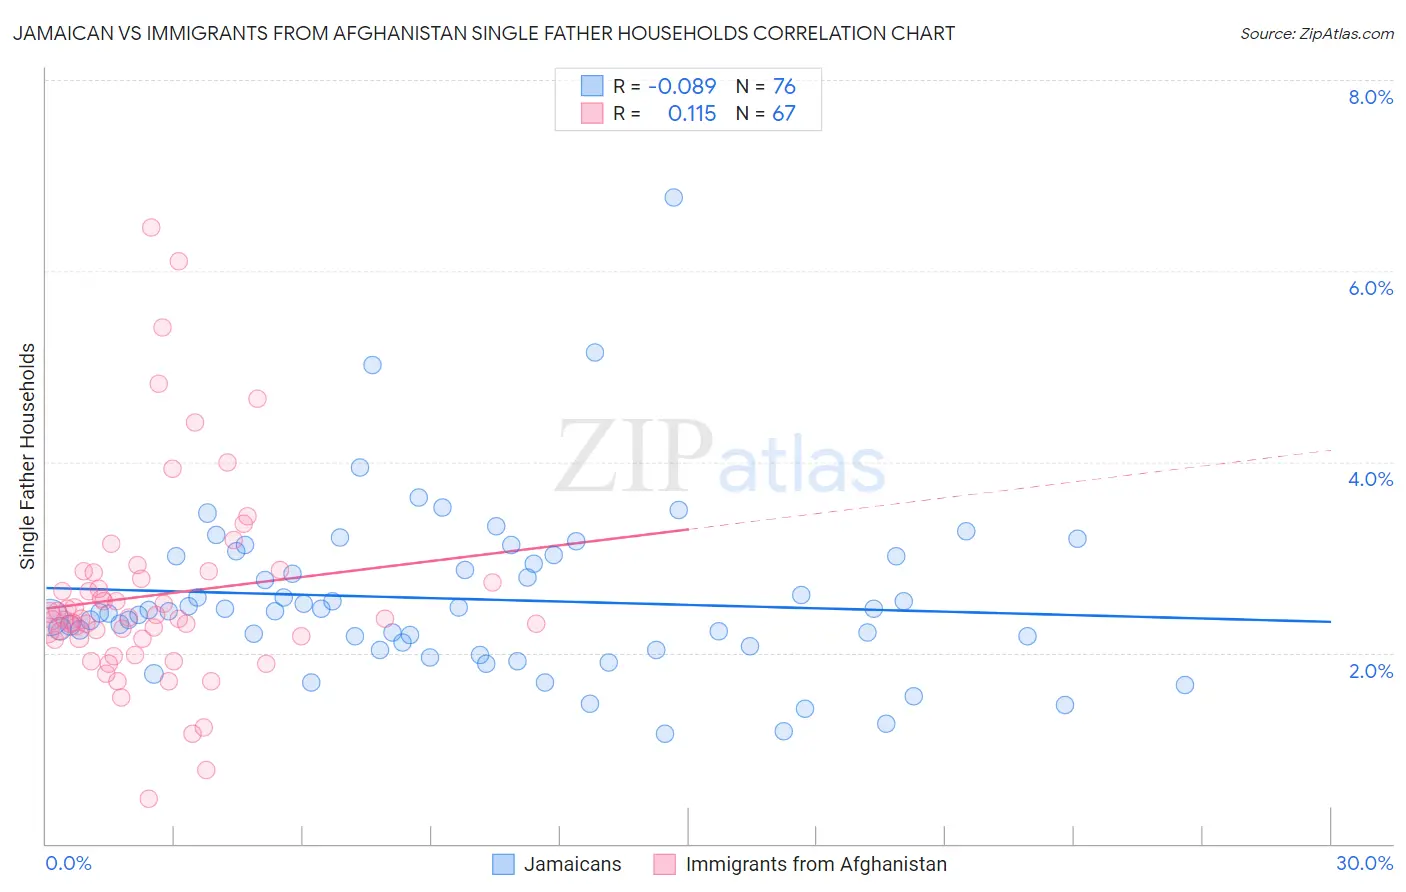
Jamaican vs Immigrants from Afghanistan Single Father Households Correlation Chart
The statistical analysis conducted on geographies consisting of 365,117,858 people shows a slight negative correlation between the proportion of Jamaicans and percentage of single father households in the United States with a correlation coefficient (R) of -0.089 and weighted average of 2.3%. Similarly, the statistical analysis conducted on geographies consisting of 147,265,555 people shows a poor positive correlation between the proportion of Immigrants from Afghanistan and percentage of single father households in the United States with a correlation coefficient (R) of 0.115 and weighted average of 2.4%, a difference of 1.6%.
Single Father Households Correlation Summary
| Measurement | Jamaican | Immigrants from Afghanistan |
| Minimum | 1.2% | 0.48% |
| Maximum | 6.8% | 6.5% |
| Range | 5.6% | 6.0% |
| Mean | 2.6% | 2.6% |
| Median | 2.4% | 2.4% |
| Interquartile 25% (IQ1) | 2.1% | 2.1% |
| Interquartile 75% (IQ3) | 3.0% | 2.8% |
| Interquartile Range (IQR) | 0.92% | 0.70% |
| Standard Deviation (Sample) | 0.88% | 1.1% |
| Standard Deviation (Population) | 0.88% | 1.1% |
Similar Demographics by Single Father Households
Demographics Similar to Jamaicans by Single Father Households
In terms of single father households, the demographic groups most similar to Jamaicans are Belgian (2.3%, a difference of 0.020%), Yugoslavian (2.3%, a difference of 0.030%), Costa Rican (2.3%, a difference of 0.040%), Welsh (2.3%, a difference of 0.040%), and Immigrants from Panama (2.4%, a difference of 0.12%).
| Demographics | Rating | Rank | Single Father Households |
| Afghans | 50.0 /100 | #174 | Average 2.3% |
| Immigrants | Jamaica | 49.1 /100 | #175 | Average 2.3% |
| Danes | 48.2 /100 | #176 | Average 2.3% |
| Colombians | 48.0 /100 | #177 | Average 2.3% |
| Costa Ricans | 44.1 /100 | #178 | Average 2.3% |
| Welsh | 44.0 /100 | #179 | Average 2.3% |
| Yugoslavians | 43.9 /100 | #180 | Average 2.3% |
| Jamaicans | 43.5 /100 | #181 | Average 2.3% |
| Belgians | 43.3 /100 | #182 | Average 2.3% |
| Immigrants | Panama | 41.8 /100 | #183 | Average 2.4% |
| Sri Lankans | 41.8 /100 | #184 | Average 2.4% |
| Nigerians | 41.0 /100 | #185 | Average 2.4% |
| Immigrants | Bosnia and Herzegovina | 40.4 /100 | #186 | Average 2.4% |
| Immigrants | Colombia | 34.0 /100 | #187 | Fair 2.4% |
| Hmong | 33.0 /100 | #188 | Fair 2.4% |
Demographics Similar to Immigrants from Afghanistan by Single Father Households
In terms of single father households, the demographic groups most similar to Immigrants from Afghanistan are Korean (2.4%, a difference of 0.0%), Ecuadorian (2.4%, a difference of 0.030%), French Canadian (2.4%, a difference of 0.050%), German Russian (2.4%, a difference of 0.15%), and White/Caucasian (2.4%, a difference of 0.16%).
| Demographics | Rating | Rank | Single Father Households |
| Scandinavians | 27.4 /100 | #198 | Fair 2.4% |
| Immigrants | Vietnam | 27.1 /100 | #199 | Fair 2.4% |
| Peruvians | 27.1 /100 | #200 | Fair 2.4% |
| Immigrants | Uganda | 26.0 /100 | #201 | Fair 2.4% |
| German Russians | 25.7 /100 | #202 | Fair 2.4% |
| French Canadians | 24.7 /100 | #203 | Fair 2.4% |
| Ecuadorians | 24.5 /100 | #204 | Fair 2.4% |
| Immigrants | Afghanistan | 24.2 /100 | #205 | Fair 2.4% |
| Koreans | 24.1 /100 | #206 | Fair 2.4% |
| Whites/Caucasians | 22.6 /100 | #207 | Fair 2.4% |
| Immigrants | Kenya | 20.3 /100 | #208 | Fair 2.4% |
| Immigrants | Peru | 19.3 /100 | #209 | Poor 2.4% |
| Immigrants | Costa Rica | 19.2 /100 | #210 | Poor 2.4% |
| Immigrants | Nigeria | 18.7 /100 | #211 | Poor 2.4% |
| Finns | 18.3 /100 | #212 | Poor 2.4% |