Jamaican vs Guatemalan Divorced or Separated
COMPARE
Jamaican
Guatemalan
Divorced or Separated
Divorced or Separated Comparison
Jamaicans
Guatemalans
12.9%
DIVORCED OR SEPARATED
0.0/ 100
METRIC RATING
293rd/ 347
METRIC RANK
12.2%
DIVORCED OR SEPARATED
26.9/ 100
METRIC RATING
201st/ 347
METRIC RANK
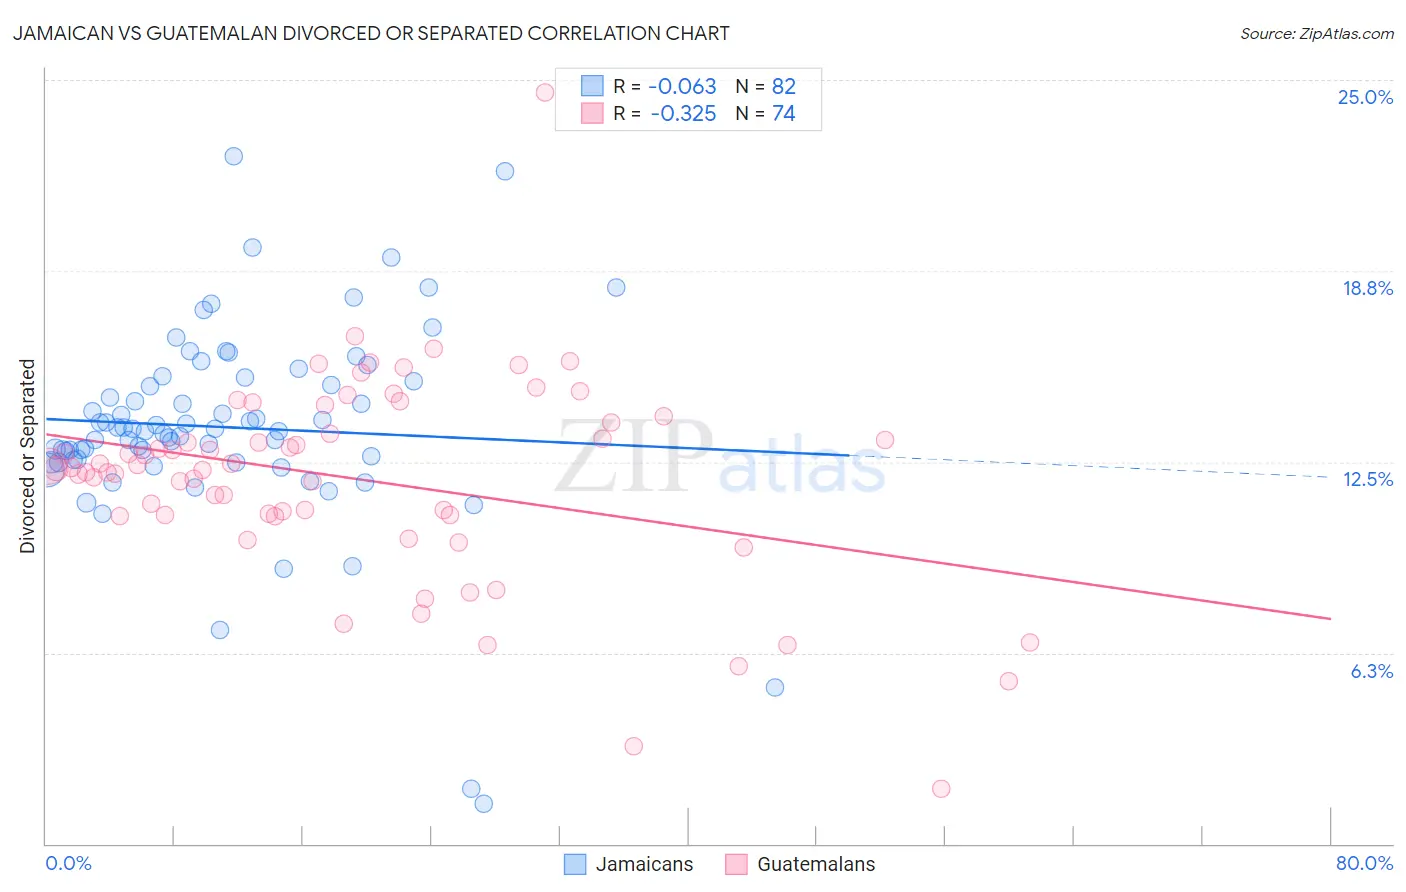
Jamaican vs Guatemalan Divorced or Separated Correlation Chart
The statistical analysis conducted on geographies consisting of 367,802,354 people shows a slight negative correlation between the proportion of Jamaicans and percentage of population currently divorced or separated in the United States with a correlation coefficient (R) of -0.063 and weighted average of 12.9%. Similarly, the statistical analysis conducted on geographies consisting of 409,404,182 people shows a mild negative correlation between the proportion of Guatemalans and percentage of population currently divorced or separated in the United States with a correlation coefficient (R) of -0.325 and weighted average of 12.2%, a difference of 6.3%.
Divorced or Separated Correlation Summary
| Measurement | Jamaican | Guatemalan |
| Minimum | 1.3% | 1.8% |
| Maximum | 22.5% | 24.6% |
| Range | 21.2% | 22.8% |
| Mean | 13.6% | 11.9% |
| Median | 13.5% | 12.3% |
| Interquartile 25% (IQ1) | 12.6% | 10.8% |
| Interquartile 75% (IQ3) | 15.2% | 13.8% |
| Interquartile Range (IQR) | 2.6% | 3.0% |
| Standard Deviation (Sample) | 3.3% | 3.4% |
| Standard Deviation (Population) | 3.3% | 3.3% |
Similar Demographics by Divorced or Separated
Demographics Similar to Jamaicans by Divorced or Separated
In terms of divorced or separated, the demographic groups most similar to Jamaicans are Apache (12.9%, a difference of 0.030%), Celtic (13.0%, a difference of 0.16%), Scotch-Irish (12.9%, a difference of 0.21%), Immigrants from Honduras (12.9%, a difference of 0.27%), and Pima (12.9%, a difference of 0.38%).
| Demographics | Rating | Rank | Divorced or Separated |
| Spanish | 0.1 /100 | #286 | Tragic 12.8% |
| Hondurans | 0.1 /100 | #287 | Tragic 12.8% |
| French Canadians | 0.1 /100 | #288 | Tragic 12.8% |
| Iroquois | 0.0 /100 | #289 | Tragic 12.9% |
| Pima | 0.0 /100 | #290 | Tragic 12.9% |
| Immigrants | Honduras | 0.0 /100 | #291 | Tragic 12.9% |
| Scotch-Irish | 0.0 /100 | #292 | Tragic 12.9% |
| Jamaicans | 0.0 /100 | #293 | Tragic 12.9% |
| Apache | 0.0 /100 | #294 | Tragic 12.9% |
| Celtics | 0.0 /100 | #295 | Tragic 13.0% |
| Nicaraguans | 0.0 /100 | #296 | Tragic 13.0% |
| Natives/Alaskans | 0.0 /100 | #297 | Tragic 13.0% |
| Venezuelans | 0.0 /100 | #298 | Tragic 13.0% |
| Immigrants | Jamaica | 0.0 /100 | #299 | Tragic 13.0% |
| Immigrants | Cabo Verde | 0.0 /100 | #300 | Tragic 13.1% |
Demographics Similar to Guatemalans by Divorced or Separated
In terms of divorced or separated, the demographic groups most similar to Guatemalans are South American (12.2%, a difference of 0.070%), Central American (12.1%, a difference of 0.10%), Nigerian (12.1%, a difference of 0.14%), Immigrants from Burma/Myanmar (12.1%, a difference of 0.15%), and Immigrants from Africa (12.1%, a difference of 0.15%).
| Demographics | Rating | Rank | Divorced or Separated |
| Immigrants | Eritrea | 31.9 /100 | #194 | Fair 12.1% |
| Immigrants | England | 31.4 /100 | #195 | Fair 12.1% |
| Immigrants | Burma/Myanmar | 30.4 /100 | #196 | Fair 12.1% |
| Immigrants | Africa | 30.3 /100 | #197 | Fair 12.1% |
| Nigerians | 30.1 /100 | #198 | Fair 12.1% |
| Central Americans | 29.4 /100 | #199 | Fair 12.1% |
| South Americans | 28.6 /100 | #200 | Fair 12.2% |
| Guatemalans | 26.9 /100 | #201 | Fair 12.2% |
| Portuguese | 23.5 /100 | #202 | Fair 12.2% |
| Immigrants | Guatemala | 23.2 /100 | #203 | Fair 12.2% |
| Kenyans | 21.8 /100 | #204 | Fair 12.2% |
| Immigrants | Costa Rica | 21.3 /100 | #205 | Fair 12.2% |
| Slovaks | 21.0 /100 | #206 | Fair 12.2% |
| Mexicans | 21.0 /100 | #207 | Fair 12.2% |
| Immigrants | Ghana | 18.8 /100 | #208 | Poor 12.2% |