Jamaican vs Spanish American Divorced or Separated
COMPARE
Jamaican
Spanish American
Divorced or Separated
Divorced or Separated Comparison
Jamaicans
Spanish Americans
12.9%
DIVORCED OR SEPARATED
0.0/ 100
METRIC RATING
293rd/ 347
METRIC RANK
13.3%
DIVORCED OR SEPARATED
0.0/ 100
METRIC RATING
315th/ 347
METRIC RANK
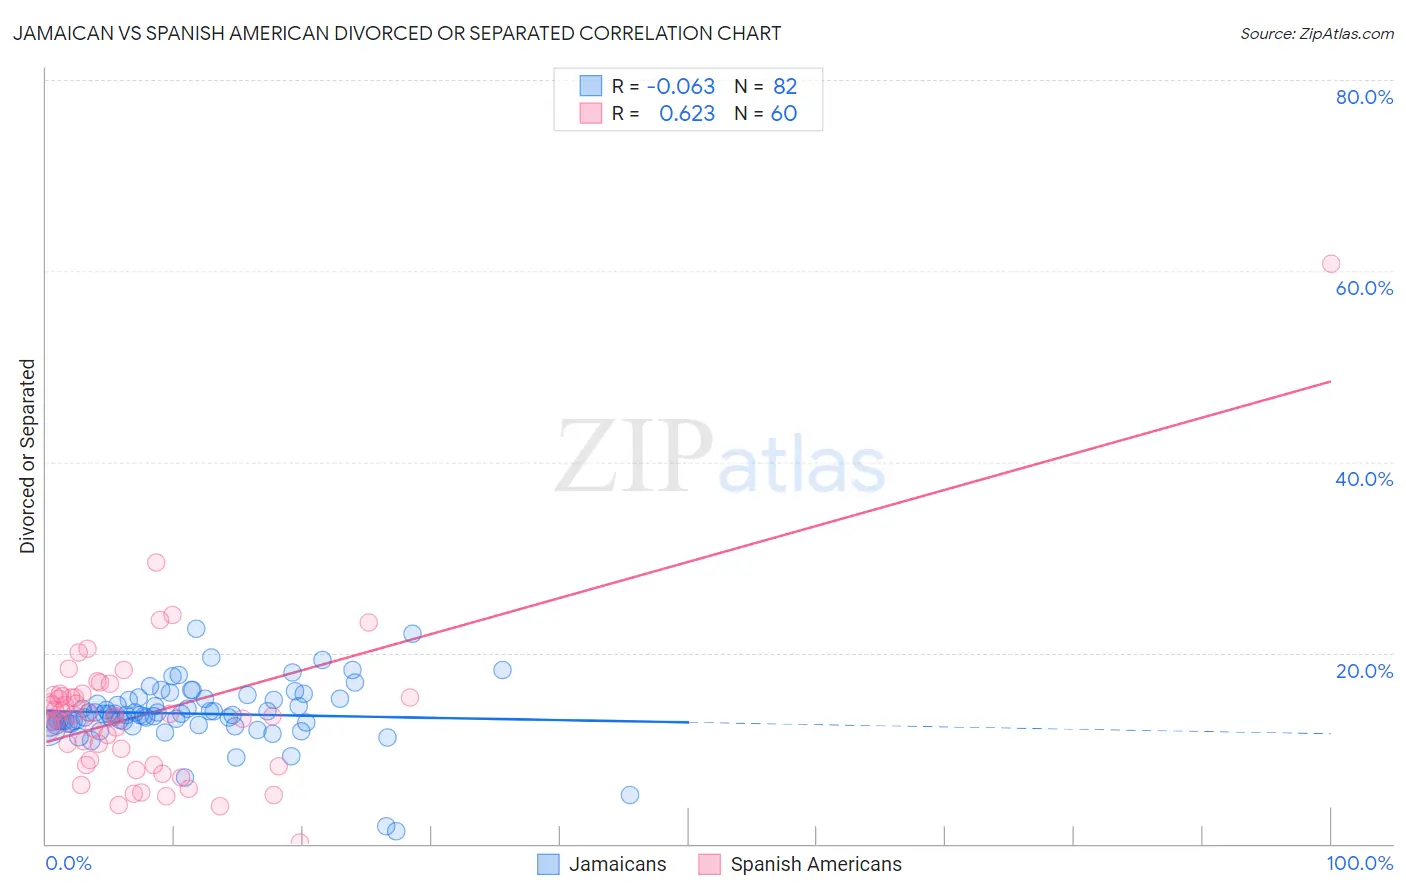
Jamaican vs Spanish American Divorced or Separated Correlation Chart
The statistical analysis conducted on geographies consisting of 367,802,354 people shows a slight negative correlation between the proportion of Jamaicans and percentage of population currently divorced or separated in the United States with a correlation coefficient (R) of -0.063 and weighted average of 12.9%. Similarly, the statistical analysis conducted on geographies consisting of 103,168,591 people shows a significant positive correlation between the proportion of Spanish Americans and percentage of population currently divorced or separated in the United States with a correlation coefficient (R) of 0.623 and weighted average of 13.3%, a difference of 3.2%.
Divorced or Separated Correlation Summary
| Measurement | Jamaican | Spanish American |
| Minimum | 1.3% | 0.10% |
| Maximum | 22.5% | 60.7% |
| Range | 21.2% | 60.6% |
| Mean | 13.6% | 13.6% |
| Median | 13.5% | 13.4% |
| Interquartile 25% (IQ1) | 12.6% | 8.5% |
| Interquartile 75% (IQ3) | 15.2% | 15.6% |
| Interquartile Range (IQR) | 2.6% | 7.0% |
| Standard Deviation (Sample) | 3.3% | 8.2% |
| Standard Deviation (Population) | 3.3% | 8.2% |
Similar Demographics by Divorced or Separated
Demographics Similar to Jamaicans by Divorced or Separated
In terms of divorced or separated, the demographic groups most similar to Jamaicans are Apache (12.9%, a difference of 0.030%), Celtic (13.0%, a difference of 0.16%), Scotch-Irish (12.9%, a difference of 0.21%), Immigrants from Honduras (12.9%, a difference of 0.27%), and Pima (12.9%, a difference of 0.38%).
| Demographics | Rating | Rank | Divorced or Separated |
| Spanish | 0.1 /100 | #286 | Tragic 12.8% |
| Hondurans | 0.1 /100 | #287 | Tragic 12.8% |
| French Canadians | 0.1 /100 | #288 | Tragic 12.8% |
| Iroquois | 0.0 /100 | #289 | Tragic 12.9% |
| Pima | 0.0 /100 | #290 | Tragic 12.9% |
| Immigrants | Honduras | 0.0 /100 | #291 | Tragic 12.9% |
| Scotch-Irish | 0.0 /100 | #292 | Tragic 12.9% |
| Jamaicans | 0.0 /100 | #293 | Tragic 12.9% |
| Apache | 0.0 /100 | #294 | Tragic 12.9% |
| Celtics | 0.0 /100 | #295 | Tragic 13.0% |
| Nicaraguans | 0.0 /100 | #296 | Tragic 13.0% |
| Natives/Alaskans | 0.0 /100 | #297 | Tragic 13.0% |
| Venezuelans | 0.0 /100 | #298 | Tragic 13.0% |
| Immigrants | Jamaica | 0.0 /100 | #299 | Tragic 13.0% |
| Immigrants | Cabo Verde | 0.0 /100 | #300 | Tragic 13.1% |
Demographics Similar to Spanish Americans by Divorced or Separated
In terms of divorced or separated, the demographic groups most similar to Spanish Americans are Tsimshian (13.3%, a difference of 0.030%), Haitian (13.3%, a difference of 0.050%), Cree (13.4%, a difference of 0.080%), Puget Sound Salish (13.4%, a difference of 0.12%), and Cajun (13.4%, a difference of 0.18%).
| Demographics | Rating | Rank | Divorced or Separated |
| Ottawa | 0.0 /100 | #308 | Tragic 13.2% |
| Americans | 0.0 /100 | #309 | Tragic 13.2% |
| Africans | 0.0 /100 | #310 | Tragic 13.2% |
| Sioux | 0.0 /100 | #311 | Tragic 13.2% |
| Blackfeet | 0.0 /100 | #312 | Tragic 13.3% |
| Immigrants | Nicaragua | 0.0 /100 | #313 | Tragic 13.3% |
| Yaqui | 0.0 /100 | #314 | Tragic 13.3% |
| Spanish Americans | 0.0 /100 | #315 | Tragic 13.3% |
| Tsimshian | 0.0 /100 | #316 | Tragic 13.3% |
| Haitians | 0.0 /100 | #317 | Tragic 13.3% |
| Cree | 0.0 /100 | #318 | Tragic 13.4% |
| Puget Sound Salish | 0.0 /100 | #319 | Tragic 13.4% |
| Cajuns | 0.0 /100 | #320 | Tragic 13.4% |
| Cheyenne | 0.0 /100 | #321 | Tragic 13.4% |
| Immigrants | Haiti | 0.0 /100 | #322 | Tragic 13.4% |