Afghan vs Italian Divorced or Separated
COMPARE
Afghan
Italian
Divorced or Separated
Divorced or Separated Comparison
Afghans
Italians
11.5%
DIVORCED OR SEPARATED
99.4/ 100
METRIC RATING
78th/ 347
METRIC RANK
11.9%
DIVORCED OR SEPARATED
77.8/ 100
METRIC RATING
148th/ 347
METRIC RANK
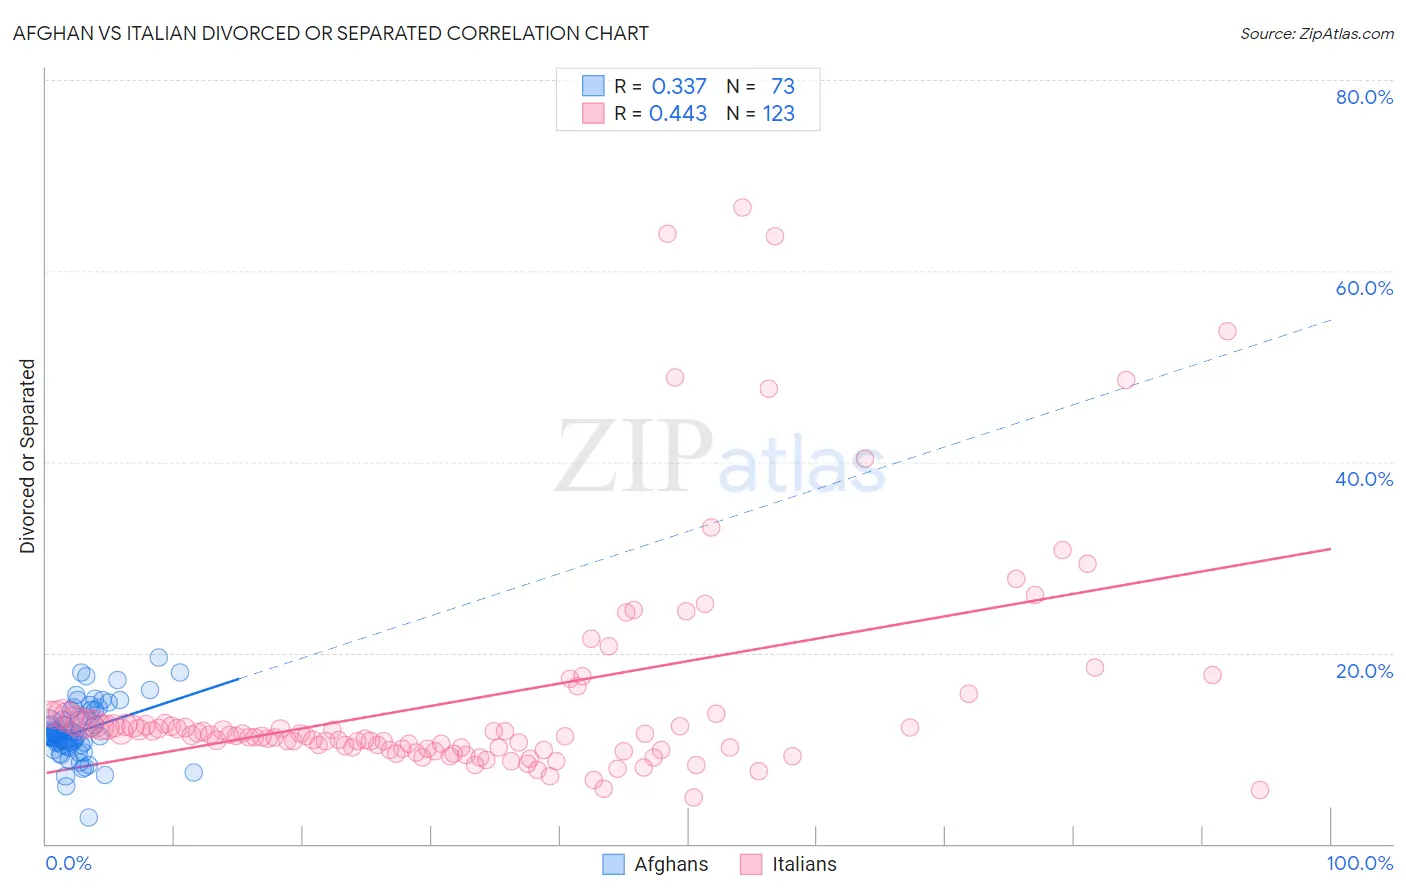
Afghan vs Italian Divorced or Separated Correlation Chart
The statistical analysis conducted on geographies consisting of 148,858,347 people shows a mild positive correlation between the proportion of Afghans and percentage of population currently divorced or separated in the United States with a correlation coefficient (R) of 0.337 and weighted average of 11.5%. Similarly, the statistical analysis conducted on geographies consisting of 574,595,053 people shows a moderate positive correlation between the proportion of Italians and percentage of population currently divorced or separated in the United States with a correlation coefficient (R) of 0.443 and weighted average of 11.9%, a difference of 3.6%.
Divorced or Separated Correlation Summary
| Measurement | Afghan | Italian |
| Minimum | 2.8% | 4.8% |
| Maximum | 19.5% | 66.7% |
| Range | 16.7% | 61.9% |
| Mean | 11.8% | 15.1% |
| Median | 11.4% | 11.4% |
| Interquartile 25% (IQ1) | 10.3% | 10.0% |
| Interquartile 75% (IQ3) | 13.7% | 12.8% |
| Interquartile Range (IQR) | 3.3% | 2.9% |
| Standard Deviation (Sample) | 2.9% | 11.7% |
| Standard Deviation (Population) | 2.9% | 11.6% |
Similar Demographics by Divorced or Separated
Demographics Similar to Afghans by Divorced or Separated
In terms of divorced or separated, the demographic groups most similar to Afghans are Guyanese (11.5%, a difference of 0.040%), Immigrants from Switzerland (11.5%, a difference of 0.060%), Russian (11.5%, a difference of 0.070%), Immigrants from Italy (11.5%, a difference of 0.10%), and Immigrants from Romania (11.5%, a difference of 0.15%).
| Demographics | Rating | Rank | Divorced or Separated |
| Paraguayans | 99.7 /100 | #71 | Exceptional 11.5% |
| Jordanians | 99.6 /100 | #72 | Exceptional 11.5% |
| Immigrants | North Macedonia | 99.6 /100 | #73 | Exceptional 11.5% |
| Taiwanese | 99.6 /100 | #74 | Exceptional 11.5% |
| Immigrants | Northern Africa | 99.6 /100 | #75 | Exceptional 11.5% |
| Albanians | 99.6 /100 | #76 | Exceptional 11.5% |
| Immigrants | Italy | 99.5 /100 | #77 | Exceptional 11.5% |
| Afghans | 99.4 /100 | #78 | Exceptional 11.5% |
| Guyanese | 99.4 /100 | #79 | Exceptional 11.5% |
| Immigrants | Switzerland | 99.4 /100 | #80 | Exceptional 11.5% |
| Russians | 99.4 /100 | #81 | Exceptional 11.5% |
| Immigrants | Romania | 99.3 /100 | #82 | Exceptional 11.5% |
| Immigrants | Bulgaria | 99.3 /100 | #83 | Exceptional 11.5% |
| Bulgarians | 99.3 /100 | #84 | Exceptional 11.5% |
| Immigrants | Albania | 99.3 /100 | #85 | Exceptional 11.5% |
Demographics Similar to Italians by Divorced or Separated
In terms of divorced or separated, the demographic groups most similar to Italians are Immigrants from Oceania (11.9%, a difference of 0.0%), Immigrants from Portugal (11.9%, a difference of 0.030%), Polish (11.9%, a difference of 0.040%), Immigrants from Grenada (11.9%, a difference of 0.070%), and Czech (11.9%, a difference of 0.070%).
| Demographics | Rating | Rank | Divorced or Separated |
| Immigrants | Morocco | 82.9 /100 | #141 | Excellent 11.9% |
| Immigrants | Zimbabwe | 81.5 /100 | #142 | Excellent 11.9% |
| Pakistanis | 81.3 /100 | #143 | Excellent 11.9% |
| Peruvians | 80.9 /100 | #144 | Excellent 11.9% |
| Croatians | 80.6 /100 | #145 | Excellent 11.9% |
| Immigrants | Grenada | 79.1 /100 | #146 | Good 11.9% |
| Poles | 78.6 /100 | #147 | Good 11.9% |
| Italians | 77.8 /100 | #148 | Good 11.9% |
| Immigrants | Oceania | 77.7 /100 | #149 | Good 11.9% |
| Immigrants | Portugal | 77.3 /100 | #150 | Good 11.9% |
| Czechs | 76.4 /100 | #151 | Good 11.9% |
| Immigrants | Hungary | 73.7 /100 | #152 | Good 11.9% |
| Austrians | 72.2 /100 | #153 | Good 12.0% |
| Chileans | 71.3 /100 | #154 | Good 12.0% |
| Japanese | 70.9 /100 | #155 | Good 12.0% |