Immigrants from St. Vincent and the Grenadines vs Italian Divorced or Separated
COMPARE
Immigrants from St. Vincent and the Grenadines
Italian
Divorced or Separated
Divorced or Separated Comparison
Immigrants from St. Vincent and the Grenadines
Italians
11.8%
DIVORCED OR SEPARATED
88.4/ 100
METRIC RATING
129th/ 347
METRIC RANK
11.9%
DIVORCED OR SEPARATED
77.8/ 100
METRIC RATING
148th/ 347
METRIC RANK
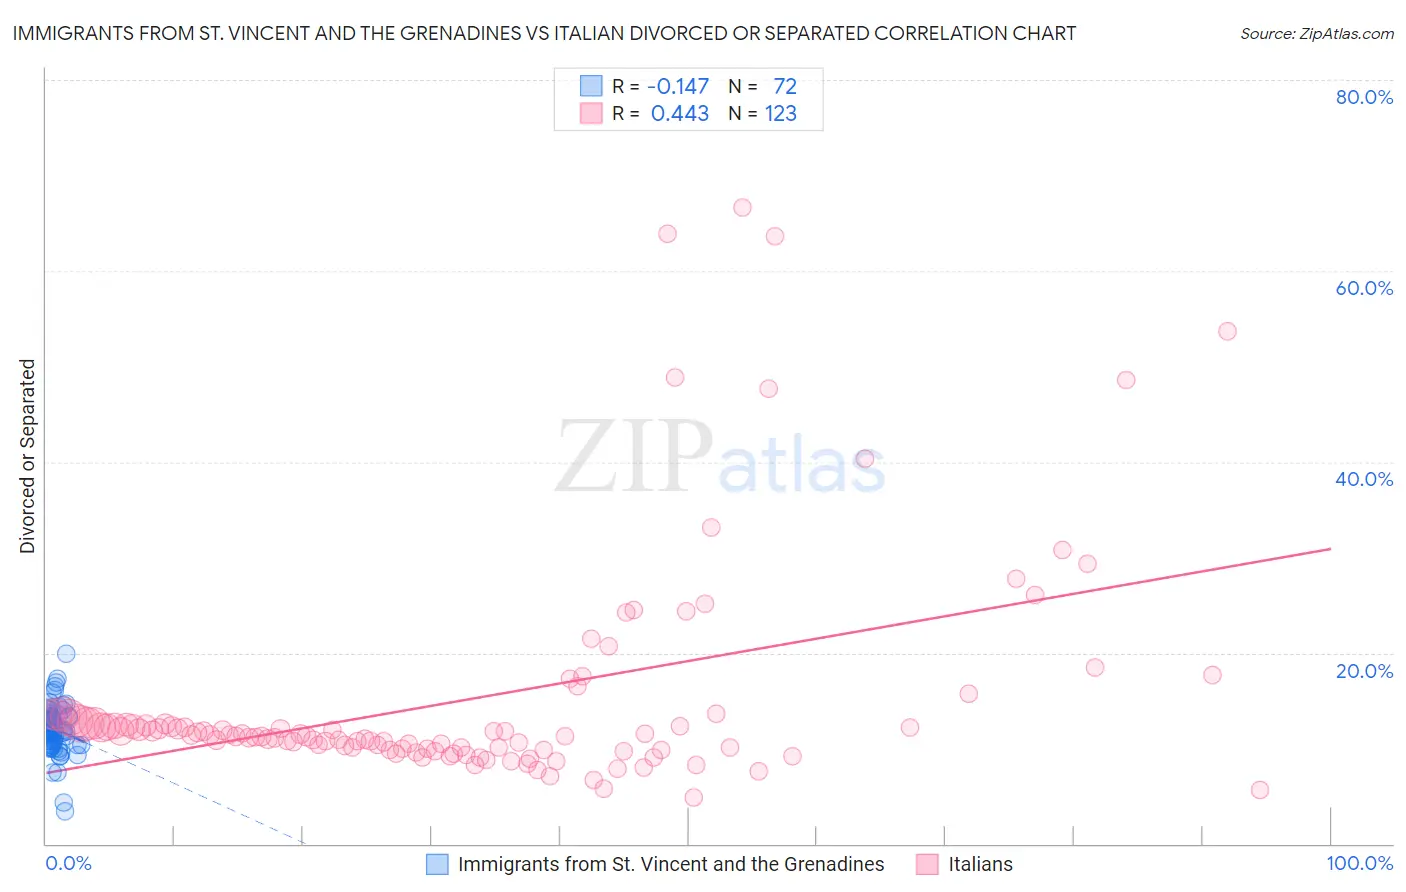
Immigrants from St. Vincent and the Grenadines vs Italian Divorced or Separated Correlation Chart
The statistical analysis conducted on geographies consisting of 56,190,890 people shows a poor negative correlation between the proportion of Immigrants from St. Vincent and the Grenadines and percentage of population currently divorced or separated in the United States with a correlation coefficient (R) of -0.147 and weighted average of 11.8%. Similarly, the statistical analysis conducted on geographies consisting of 574,595,053 people shows a moderate positive correlation between the proportion of Italians and percentage of population currently divorced or separated in the United States with a correlation coefficient (R) of 0.443 and weighted average of 11.9%, a difference of 0.69%.
Divorced or Separated Correlation Summary
| Measurement | Immigrants from St. Vincent and the Grenadines | Italian |
| Minimum | 3.4% | 4.8% |
| Maximum | 19.9% | 66.7% |
| Range | 16.5% | 61.9% |
| Mean | 12.0% | 15.1% |
| Median | 12.1% | 11.4% |
| Interquartile 25% (IQ1) | 10.4% | 10.0% |
| Interquartile 75% (IQ3) | 13.4% | 12.8% |
| Interquartile Range (IQR) | 3.0% | 2.9% |
| Standard Deviation (Sample) | 2.6% | 11.7% |
| Standard Deviation (Population) | 2.6% | 11.6% |
Demographics Similar to Immigrants from St. Vincent and the Grenadines and Italians by Divorced or Separated
In terms of divorced or separated, the demographic groups most similar to Immigrants from St. Vincent and the Grenadines are Immigrants from Austria (11.8%, a difference of 0.010%), Immigrants from Cambodia (11.8%, a difference of 0.020%), Immigrants from Ecuador (11.8%, a difference of 0.040%), Immigrants from Afghanistan (11.8%, a difference of 0.040%), and New Zealander (11.9%, a difference of 0.070%). Similarly, the demographic groups most similar to Italians are Polish (11.9%, a difference of 0.040%), Immigrants from Grenada (11.9%, a difference of 0.070%), Croatian (11.9%, a difference of 0.15%), Peruvian (11.9%, a difference of 0.17%), and Pakistani (11.9%, a difference of 0.19%).
| Demographics | Rating | Rank | Divorced or Separated |
| Immigrants | Ecuador | 88.9 /100 | #128 | Excellent 11.8% |
| Immigrants | St. Vincent and the Grenadines | 88.4 /100 | #129 | Excellent 11.8% |
| Immigrants | Austria | 88.2 /100 | #130 | Excellent 11.8% |
| Immigrants | Cambodia | 88.2 /100 | #131 | Excellent 11.8% |
| Immigrants | Afghanistan | 87.9 /100 | #132 | Excellent 11.8% |
| New Zealanders | 87.5 /100 | #133 | Excellent 11.9% |
| Argentineans | 85.1 /100 | #134 | Excellent 11.9% |
| Danes | 84.8 /100 | #135 | Excellent 11.9% |
| Carpatho Rusyns | 84.8 /100 | #136 | Excellent 11.9% |
| Alsatians | 84.0 /100 | #137 | Excellent 11.9% |
| Immigrants | Netherlands | 83.9 /100 | #138 | Excellent 11.9% |
| Australians | 83.6 /100 | #139 | Excellent 11.9% |
| Lebanese | 83.4 /100 | #140 | Excellent 11.9% |
| Immigrants | Morocco | 82.9 /100 | #141 | Excellent 11.9% |
| Immigrants | Zimbabwe | 81.5 /100 | #142 | Excellent 11.9% |
| Pakistanis | 81.3 /100 | #143 | Excellent 11.9% |
| Peruvians | 80.9 /100 | #144 | Excellent 11.9% |
| Croatians | 80.6 /100 | #145 | Excellent 11.9% |
| Immigrants | Grenada | 79.1 /100 | #146 | Good 11.9% |
| Poles | 78.6 /100 | #147 | Good 11.9% |
| Italians | 77.8 /100 | #148 | Good 11.9% |