Jamaican vs Immigrants from Sri Lanka Married-couple Households
COMPARE
Jamaican
Immigrants from Sri Lanka
Married-couple Households
Married-couple Households Comparison
Jamaicans
Immigrants from Sri Lanka
40.9%
MARRIED-COUPLE HOUSEHOLDS
0.0/ 100
METRIC RATING
314th/ 347
METRIC RANK
48.7%
MARRIED-COUPLE HOUSEHOLDS
99.4/ 100
METRIC RATING
49th/ 347
METRIC RANK
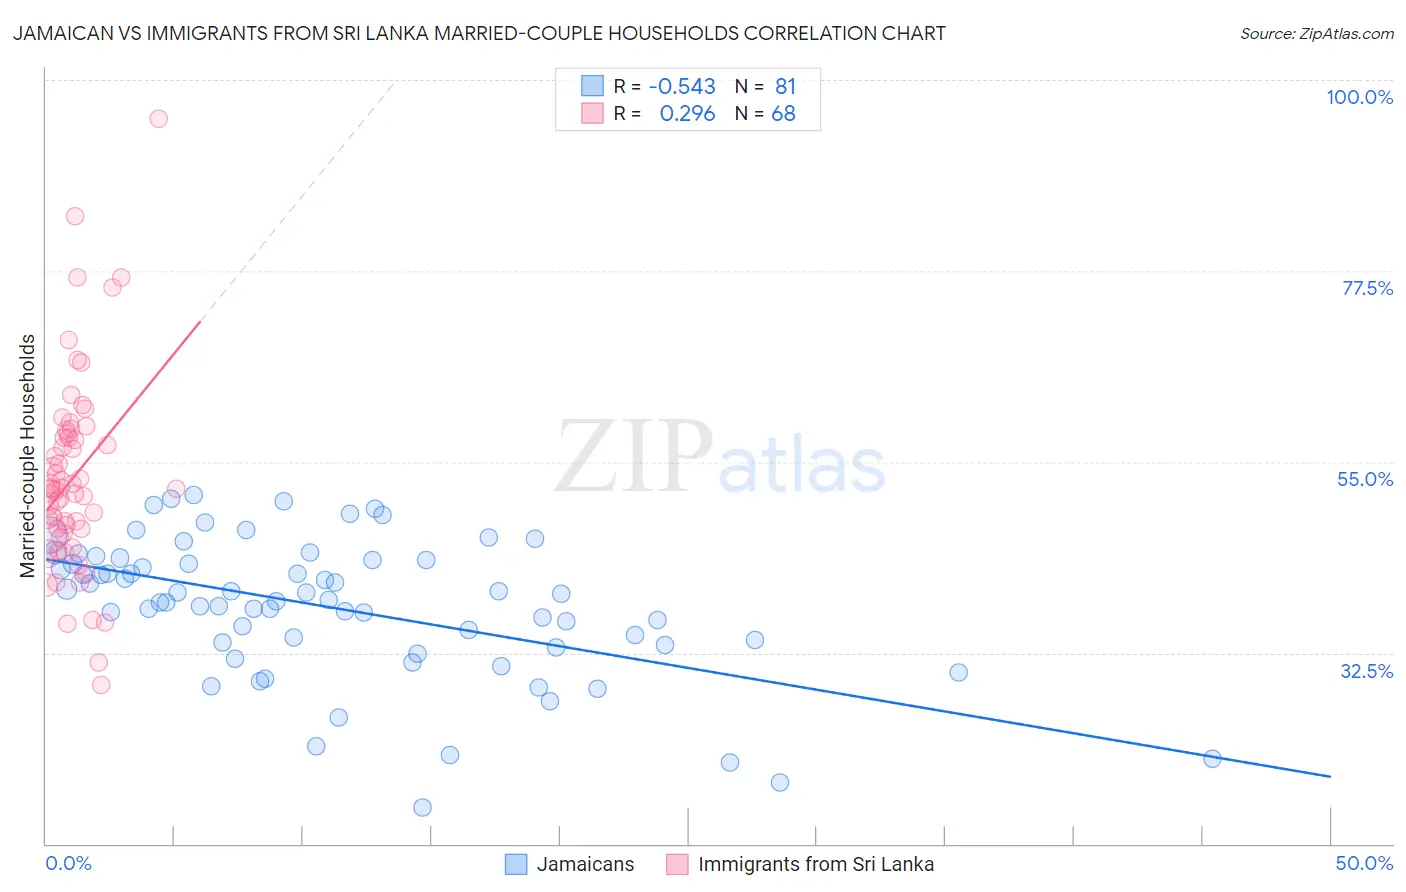
Jamaican vs Immigrants from Sri Lanka Married-couple Households Correlation Chart
The statistical analysis conducted on geographies consisting of 367,621,560 people shows a substantial negative correlation between the proportion of Jamaicans and percentage of married-couple family households in the United States with a correlation coefficient (R) of -0.543 and weighted average of 40.9%. Similarly, the statistical analysis conducted on geographies consisting of 149,682,536 people shows a weak positive correlation between the proportion of Immigrants from Sri Lanka and percentage of married-couple family households in the United States with a correlation coefficient (R) of 0.296 and weighted average of 48.7%, a difference of 19.1%.
Married-couple Households Correlation Summary
| Measurement | Jamaican | Immigrants from Sri Lanka |
| Minimum | 14.3% | 28.8% |
| Maximum | 51.0% | 95.4% |
| Range | 36.7% | 66.7% |
| Mean | 37.9% | 53.1% |
| Median | 38.7% | 51.8% |
| Interquartile 25% (IQ1) | 33.6% | 46.8% |
| Interquartile 75% (IQ3) | 43.5% | 58.1% |
| Interquartile Range (IQR) | 9.9% | 11.3% |
| Standard Deviation (Sample) | 8.1% | 11.6% |
| Standard Deviation (Population) | 8.1% | 11.5% |
Similar Demographics by Married-couple Households
Demographics Similar to Jamaicans by Married-couple Households
In terms of married-couple households, the demographic groups most similar to Jamaicans are Immigrants from Haiti (40.9%, a difference of 0.080%), Trinidadian and Tobagonian (40.9%, a difference of 0.080%), African (40.9%, a difference of 0.14%), Colville (41.0%, a difference of 0.22%), and Immigrants from Caribbean (40.8%, a difference of 0.26%).
| Demographics | Rating | Rank | Married-couple Households |
| Immigrants | Western Africa | 0.0 /100 | #307 | Tragic 41.4% |
| Crow | 0.0 /100 | #308 | Tragic 41.4% |
| Immigrants | Trinidad and Tobago | 0.0 /100 | #309 | Tragic 41.2% |
| Haitians | 0.0 /100 | #310 | Tragic 41.2% |
| Colville | 0.0 /100 | #311 | Tragic 41.0% |
| Africans | 0.0 /100 | #312 | Tragic 40.9% |
| Immigrants | Haiti | 0.0 /100 | #313 | Tragic 40.9% |
| Jamaicans | 0.0 /100 | #314 | Tragic 40.9% |
| Trinidadians and Tobagonians | 0.0 /100 | #315 | Tragic 40.9% |
| Immigrants | Caribbean | 0.0 /100 | #316 | Tragic 40.8% |
| Immigrants | Jamaica | 0.0 /100 | #317 | Tragic 40.7% |
| Liberians | 0.0 /100 | #318 | Tragic 40.7% |
| Bahamians | 0.0 /100 | #319 | Tragic 40.5% |
| West Indians | 0.0 /100 | #320 | Tragic 40.3% |
| Immigrants | Liberia | 0.0 /100 | #321 | Tragic 40.3% |
Demographics Similar to Immigrants from Sri Lanka by Married-couple Households
In terms of married-couple households, the demographic groups most similar to Immigrants from Sri Lanka are Samoan (48.7%, a difference of 0.040%), Indian (Asian) (48.7%, a difference of 0.060%), Eastern European (48.6%, a difference of 0.080%), British (48.7%, a difference of 0.12%), and Irish (48.6%, a difference of 0.12%).
| Demographics | Rating | Rank | Married-couple Households |
| Immigrants | Vietnam | 99.6 /100 | #42 | Exceptional 48.8% |
| Immigrants | Iran | 99.6 /100 | #43 | Exceptional 48.8% |
| Welsh | 99.5 /100 | #44 | Exceptional 48.8% |
| Immigrants | Eastern Asia | 99.5 /100 | #45 | Exceptional 48.8% |
| Tsimshian | 99.5 /100 | #46 | Exceptional 48.7% |
| British | 99.5 /100 | #47 | Exceptional 48.7% |
| Indians (Asian) | 99.4 /100 | #48 | Exceptional 48.7% |
| Immigrants | Sri Lanka | 99.4 /100 | #49 | Exceptional 48.7% |
| Samoans | 99.4 /100 | #50 | Exceptional 48.7% |
| Eastern Europeans | 99.3 /100 | #51 | Exceptional 48.6% |
| Irish | 99.3 /100 | #52 | Exceptional 48.6% |
| Whites/Caucasians | 99.3 /100 | #53 | Exceptional 48.6% |
| Immigrants | Lithuania | 99.3 /100 | #54 | Exceptional 48.6% |
| Austrians | 99.3 /100 | #55 | Exceptional 48.6% |
| Immigrants | Northern Europe | 99.3 /100 | #56 | Exceptional 48.6% |