Immigrants from Kazakhstan vs Immigrants from Sri Lanka Married-couple Households
COMPARE
Immigrants from Kazakhstan
Immigrants from Sri Lanka
Married-couple Households
Married-couple Households Comparison
Immigrants from Kazakhstan
Immigrants from Sri Lanka
46.8%
MARRIED-COUPLE HOUSEHOLDS
70.0/ 100
METRIC RATING
164th/ 347
METRIC RANK
48.7%
MARRIED-COUPLE HOUSEHOLDS
99.4/ 100
METRIC RATING
49th/ 347
METRIC RANK
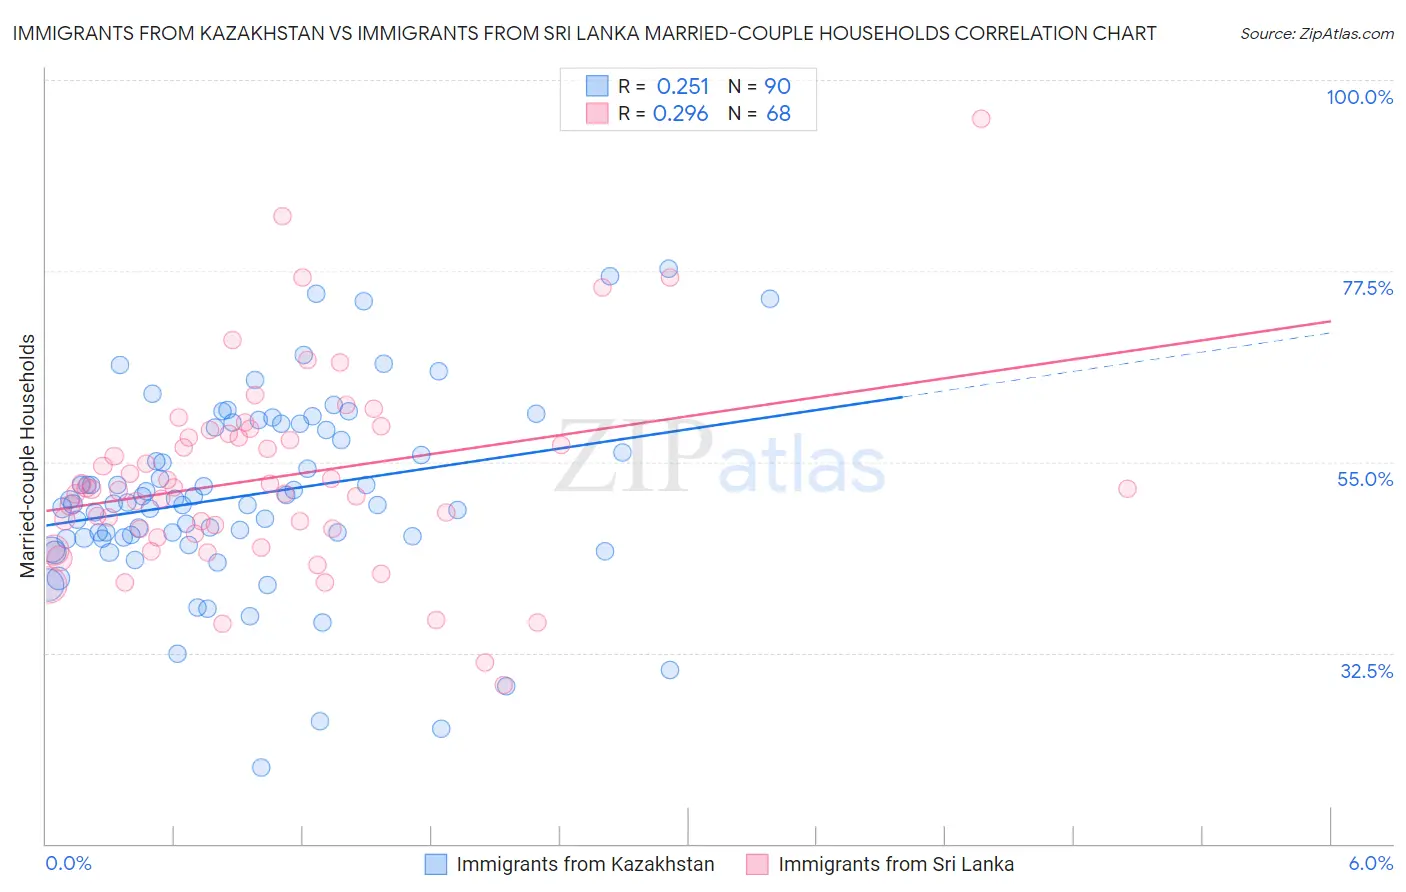
Immigrants from Kazakhstan vs Immigrants from Sri Lanka Married-couple Households Correlation Chart
The statistical analysis conducted on geographies consisting of 124,426,668 people shows a weak positive correlation between the proportion of Immigrants from Kazakhstan and percentage of married-couple family households in the United States with a correlation coefficient (R) of 0.251 and weighted average of 46.8%. Similarly, the statistical analysis conducted on geographies consisting of 149,682,536 people shows a weak positive correlation between the proportion of Immigrants from Sri Lanka and percentage of married-couple family households in the United States with a correlation coefficient (R) of 0.296 and weighted average of 48.7%, a difference of 4.0%.
Married-couple Households Correlation Summary
| Measurement | Immigrants from Kazakhstan | Immigrants from Sri Lanka |
| Minimum | 19.0% | 28.8% |
| Maximum | 77.7% | 95.4% |
| Range | 58.8% | 66.7% |
| Mean | 51.1% | 53.1% |
| Median | 50.2% | 51.8% |
| Interquartile 25% (IQ1) | 46.0% | 46.8% |
| Interquartile 75% (IQ3) | 59.1% | 58.1% |
| Interquartile Range (IQR) | 13.0% | 11.3% |
| Standard Deviation (Sample) | 11.1% | 11.6% |
| Standard Deviation (Population) | 11.1% | 11.5% |
Similar Demographics by Married-couple Households
Demographics Similar to Immigrants from Kazakhstan by Married-couple Households
In terms of married-couple households, the demographic groups most similar to Immigrants from Kazakhstan are Immigrants from Southern Europe (46.8%, a difference of 0.0%), Immigrants from Turkey (46.8%, a difference of 0.010%), Colombian (46.8%, a difference of 0.050%), Delaware (46.8%, a difference of 0.060%), and Iraqi (46.9%, a difference of 0.080%).
| Demographics | Rating | Rank | Married-couple Households |
| Immigrants | Oceania | 74.8 /100 | #157 | Good 46.9% |
| Immigrants | Nonimmigrants | 73.3 /100 | #158 | Good 46.9% |
| Osage | 73.2 /100 | #159 | Good 46.9% |
| Iraqis | 71.7 /100 | #160 | Good 46.9% |
| Delaware | 71.2 /100 | #161 | Good 46.8% |
| Colombians | 71.0 /100 | #162 | Good 46.8% |
| Immigrants | Turkey | 70.2 /100 | #163 | Good 46.8% |
| Immigrants | Kazakhstan | 70.0 /100 | #164 | Good 46.8% |
| Immigrants | Southern Europe | 69.9 /100 | #165 | Good 46.8% |
| Cherokee | 65.7 /100 | #166 | Good 46.7% |
| Immigrants | Croatia | 64.2 /100 | #167 | Good 46.7% |
| Israelis | 62.3 /100 | #168 | Good 46.7% |
| Spanish American Indians | 59.4 /100 | #169 | Average 46.6% |
| South Americans | 58.0 /100 | #170 | Average 46.6% |
| Immigrants | Chile | 55.7 /100 | #171 | Average 46.5% |
Demographics Similar to Immigrants from Sri Lanka by Married-couple Households
In terms of married-couple households, the demographic groups most similar to Immigrants from Sri Lanka are Samoan (48.7%, a difference of 0.040%), Indian (Asian) (48.7%, a difference of 0.060%), Eastern European (48.6%, a difference of 0.080%), British (48.7%, a difference of 0.12%), and Irish (48.6%, a difference of 0.12%).
| Demographics | Rating | Rank | Married-couple Households |
| Immigrants | Vietnam | 99.6 /100 | #42 | Exceptional 48.8% |
| Immigrants | Iran | 99.6 /100 | #43 | Exceptional 48.8% |
| Welsh | 99.5 /100 | #44 | Exceptional 48.8% |
| Immigrants | Eastern Asia | 99.5 /100 | #45 | Exceptional 48.8% |
| Tsimshian | 99.5 /100 | #46 | Exceptional 48.7% |
| British | 99.5 /100 | #47 | Exceptional 48.7% |
| Indians (Asian) | 99.4 /100 | #48 | Exceptional 48.7% |
| Immigrants | Sri Lanka | 99.4 /100 | #49 | Exceptional 48.7% |
| Samoans | 99.4 /100 | #50 | Exceptional 48.7% |
| Eastern Europeans | 99.3 /100 | #51 | Exceptional 48.6% |
| Irish | 99.3 /100 | #52 | Exceptional 48.6% |
| Whites/Caucasians | 99.3 /100 | #53 | Exceptional 48.6% |
| Immigrants | Lithuania | 99.3 /100 | #54 | Exceptional 48.6% |
| Austrians | 99.3 /100 | #55 | Exceptional 48.6% |
| Immigrants | Northern Europe | 99.3 /100 | #56 | Exceptional 48.6% |