Jamaican vs Immigrants from Chile Single Mother Households
COMPARE
Jamaican
Immigrants from Chile
Single Mother Households
Single Mother Households Comparison
Jamaicans
Immigrants from Chile
8.2%
SINGLE MOTHER HOUSEHOLDS
0.0/ 100
METRIC RATING
319th/ 347
METRIC RANK
6.3%
SINGLE MOTHER HOUSEHOLDS
58.3/ 100
METRIC RATING
168th/ 347
METRIC RANK
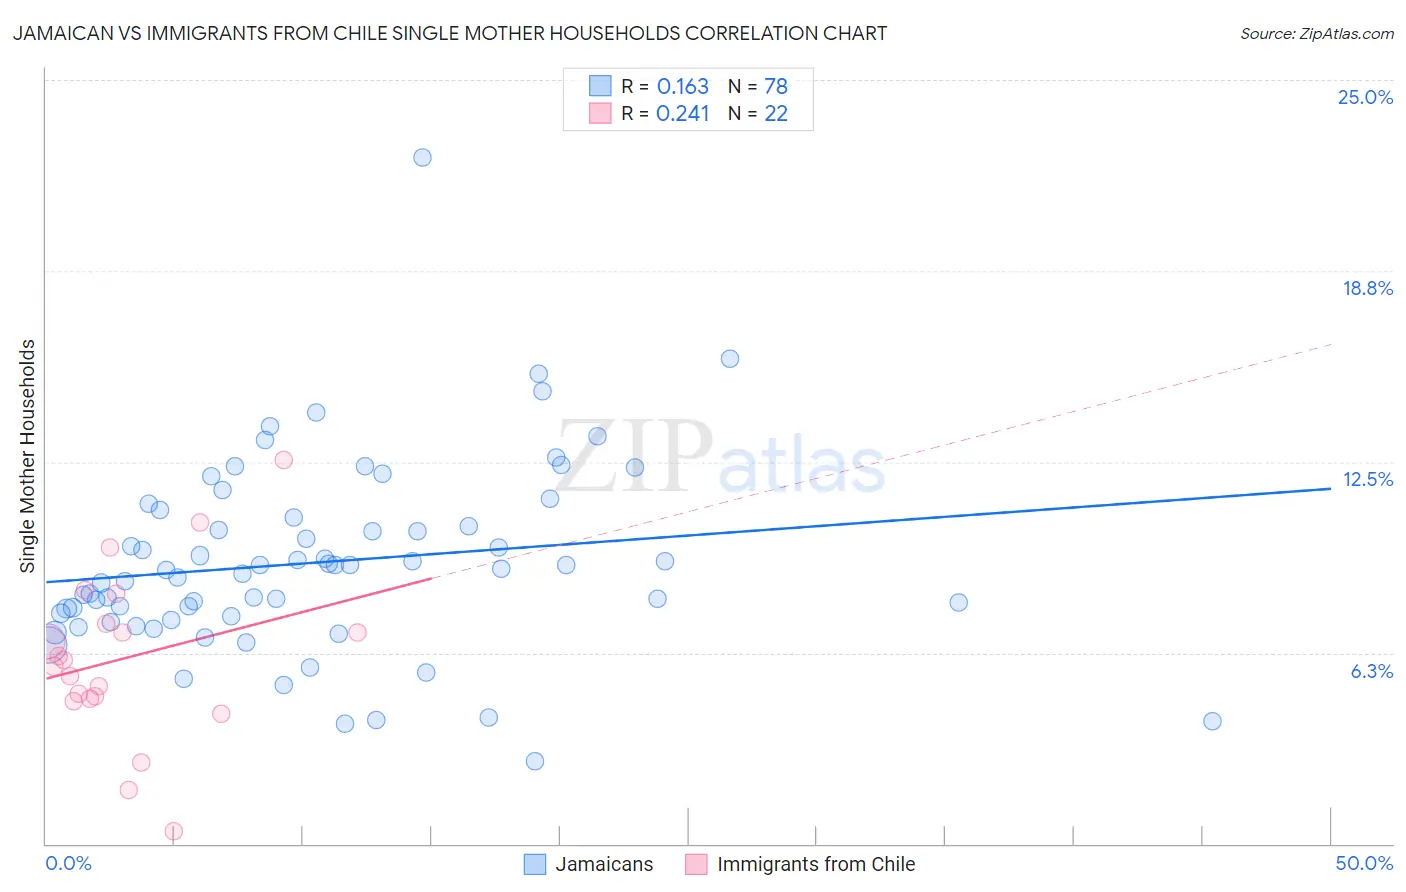
Jamaican vs Immigrants from Chile Single Mother Households Correlation Chart
The statistical analysis conducted on geographies consisting of 367,100,383 people shows a poor positive correlation between the proportion of Jamaicans and percentage of single mother households in the United States with a correlation coefficient (R) of 0.163 and weighted average of 8.2%. Similarly, the statistical analysis conducted on geographies consisting of 218,462,093 people shows a weak positive correlation between the proportion of Immigrants from Chile and percentage of single mother households in the United States with a correlation coefficient (R) of 0.241 and weighted average of 6.3%, a difference of 31.8%.
Single Mother Households Correlation Summary
| Measurement | Jamaican | Immigrants from Chile |
| Minimum | 2.7% | 0.42% |
| Maximum | 22.5% | 12.6% |
| Range | 19.8% | 12.2% |
| Mean | 9.2% | 6.1% |
| Median | 9.0% | 5.9% |
| Interquartile 25% (IQ1) | 7.4% | 4.7% |
| Interquartile 75% (IQ3) | 10.7% | 7.2% |
| Interquartile Range (IQR) | 3.2% | 2.5% |
| Standard Deviation (Sample) | 3.1% | 2.8% |
| Standard Deviation (Population) | 3.1% | 2.7% |
Similar Demographics by Single Mother Households
Demographics Similar to Jamaicans by Single Mother Households
In terms of single mother households, the demographic groups most similar to Jamaicans are Senegalese (8.2%, a difference of 0.11%), Bahamian (8.3%, a difference of 0.12%), Immigrants from Senegal (8.3%, a difference of 0.36%), Pima (8.3%, a difference of 0.44%), and Immigrants from Honduras (8.2%, a difference of 0.68%).
| Demographics | Rating | Rank | Single Mother Households |
| Bangladeshis | 0.0 /100 | #312 | Tragic 8.1% |
| Immigrants | Grenada | 0.0 /100 | #313 | Tragic 8.2% |
| Immigrants | Mexico | 0.0 /100 | #314 | Tragic 8.2% |
| Immigrants | Western Africa | 0.0 /100 | #315 | Tragic 8.2% |
| Africans | 0.0 /100 | #316 | Tragic 8.2% |
| Immigrants | Honduras | 0.0 /100 | #317 | Tragic 8.2% |
| Senegalese | 0.0 /100 | #318 | Tragic 8.2% |
| Jamaicans | 0.0 /100 | #319 | Tragic 8.2% |
| Bahamians | 0.0 /100 | #320 | Tragic 8.3% |
| Immigrants | Senegal | 0.0 /100 | #321 | Tragic 8.3% |
| Pima | 0.0 /100 | #322 | Tragic 8.3% |
| Haitians | 0.0 /100 | #323 | Tragic 8.3% |
| Immigrants | Jamaica | 0.0 /100 | #324 | Tragic 8.4% |
| Immigrants | Caribbean | 0.0 /100 | #325 | Tragic 8.4% |
| British West Indians | 0.0 /100 | #326 | Tragic 8.4% |
Demographics Similar to Immigrants from Chile by Single Mother Households
In terms of single mother households, the demographic groups most similar to Immigrants from Chile are Puget Sound Salish (6.3%, a difference of 0.020%), Brazilian (6.2%, a difference of 0.090%), Immigrants from Oceania (6.3%, a difference of 0.42%), Sri Lankan (6.2%, a difference of 0.65%), and Afghan (6.3%, a difference of 0.65%).
| Demographics | Rating | Rank | Single Mother Households |
| Immigrants | Germany | 72.4 /100 | #161 | Good 6.1% |
| Immigrants | Zimbabwe | 69.9 /100 | #162 | Good 6.2% |
| Alsatians | 68.7 /100 | #163 | Good 6.2% |
| Immigrants | Northern Africa | 68.0 /100 | #164 | Good 6.2% |
| Immigrants | Syria | 67.4 /100 | #165 | Good 6.2% |
| Sri Lankans | 63.9 /100 | #166 | Good 6.2% |
| Brazilians | 59.1 /100 | #167 | Average 6.2% |
| Immigrants | Chile | 58.3 /100 | #168 | Average 6.3% |
| Puget Sound Salish | 58.1 /100 | #169 | Average 6.3% |
| Immigrants | Oceania | 54.6 /100 | #170 | Average 6.3% |
| Afghans | 52.5 /100 | #171 | Average 6.3% |
| Immigrants | South Eastern Asia | 52.2 /100 | #172 | Average 6.3% |
| Immigrants | Vietnam | 51.5 /100 | #173 | Average 6.3% |
| Immigrants | Morocco | 50.0 /100 | #174 | Average 6.3% |
| Marshallese | 45.8 /100 | #175 | Average 6.3% |