Jamaican vs Immigrants from Chile 10th Grade
COMPARE
Jamaican
Immigrants from Chile
10th Grade
10th Grade Comparison
Jamaicans
Immigrants from Chile
92.8%
10TH GRADE
1.2/ 100
METRIC RATING
250th/ 347
METRIC RANK
93.4%
10TH GRADE
18.8/ 100
METRIC RATING
209th/ 347
METRIC RANK
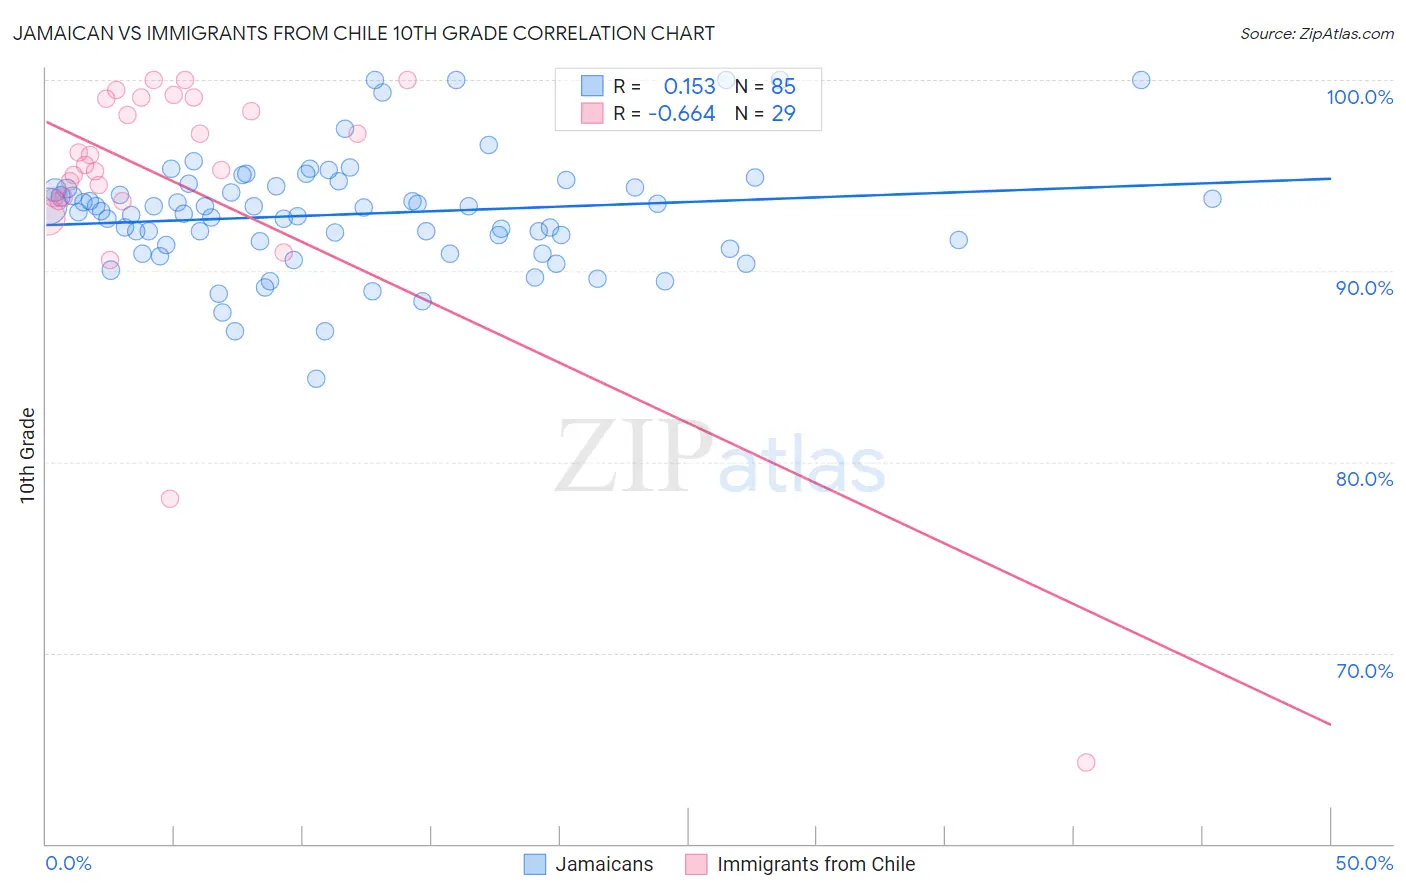
Jamaican vs Immigrants from Chile 10th Grade Correlation Chart
The statistical analysis conducted on geographies consisting of 368,084,732 people shows a poor positive correlation between the proportion of Jamaicans and percentage of population with at least 10th grade education in the United States with a correlation coefficient (R) of 0.153 and weighted average of 92.8%. Similarly, the statistical analysis conducted on geographies consisting of 218,647,266 people shows a significant negative correlation between the proportion of Immigrants from Chile and percentage of population with at least 10th grade education in the United States with a correlation coefficient (R) of -0.664 and weighted average of 93.4%, a difference of 0.66%.
10th Grade Correlation Summary
| Measurement | Jamaican | Immigrants from Chile |
| Minimum | 84.4% | 64.3% |
| Maximum | 100.0% | 100.0% |
| Range | 15.6% | 35.7% |
| Mean | 93.0% | 94.5% |
| Median | 93.1% | 95.6% |
| Interquartile 25% (IQ1) | 91.2% | 93.8% |
| Interquartile 75% (IQ3) | 94.4% | 99.0% |
| Interquartile Range (IQR) | 3.2% | 5.3% |
| Standard Deviation (Sample) | 3.0% | 7.2% |
| Standard Deviation (Population) | 3.0% | 7.1% |
Similar Demographics by 10th Grade
Demographics Similar to Jamaicans by 10th Grade
In terms of 10th grade, the demographic groups most similar to Jamaicans are Immigrants from Senegal (92.8%, a difference of 0.020%), Colombian (92.8%, a difference of 0.030%), Immigrants from Afghanistan (92.8%, a difference of 0.040%), Immigrants from Thailand (92.8%, a difference of 0.050%), and South American (92.8%, a difference of 0.060%).
| Demographics | Rating | Rank | 10th Grade |
| Senegalese | 2.4 /100 | #243 | Tragic 93.0% |
| Spanish Americans | 2.1 /100 | #244 | Tragic 92.9% |
| Uruguayans | 1.8 /100 | #245 | Tragic 92.9% |
| Immigrants | Middle Africa | 1.7 /100 | #246 | Tragic 92.9% |
| Immigrants | Afghanistan | 1.4 /100 | #247 | Tragic 92.8% |
| Colombians | 1.4 /100 | #248 | Tragic 92.8% |
| Immigrants | Senegal | 1.4 /100 | #249 | Tragic 92.8% |
| Jamaicans | 1.2 /100 | #250 | Tragic 92.8% |
| Immigrants | Thailand | 1.0 /100 | #251 | Tragic 92.8% |
| South Americans | 0.9 /100 | #252 | Tragic 92.8% |
| Ghanaians | 0.9 /100 | #253 | Tragic 92.8% |
| Armenians | 0.9 /100 | #254 | Tragic 92.7% |
| Immigrants | Bolivia | 0.7 /100 | #255 | Tragic 92.7% |
| Immigrants | Nigeria | 0.7 /100 | #256 | Tragic 92.7% |
| U.S. Virgin Islanders | 0.7 /100 | #257 | Tragic 92.7% |
Demographics Similar to Immigrants from Chile by 10th Grade
In terms of 10th grade, the demographic groups most similar to Immigrants from Chile are Samoan (93.4%, a difference of 0.010%), Immigrants from Syria (93.4%, a difference of 0.010%), Immigrants from Western Asia (93.4%, a difference of 0.020%), Ute (93.4%, a difference of 0.020%), and Immigrants from Indonesia (93.4%, a difference of 0.020%).
| Demographics | Rating | Rank | 10th Grade |
| Immigrants | Uganda | 20.9 /100 | #202 | Fair 93.5% |
| Immigrants | Western Asia | 20.6 /100 | #203 | Fair 93.4% |
| Ute | 20.3 /100 | #204 | Fair 93.4% |
| Immigrants | Indonesia | 20.2 /100 | #205 | Fair 93.4% |
| Immigrants | Sudan | 20.0 /100 | #206 | Fair 93.4% |
| Samoans | 19.5 /100 | #207 | Poor 93.4% |
| Immigrants | Syria | 19.4 /100 | #208 | Poor 93.4% |
| Immigrants | Chile | 18.8 /100 | #209 | Poor 93.4% |
| Indians (Asian) | 17.6 /100 | #210 | Poor 93.4% |
| Cajuns | 16.9 /100 | #211 | Poor 93.4% |
| Immigrants | Zaire | 16.7 /100 | #212 | Poor 93.4% |
| Immigrants | Asia | 15.7 /100 | #213 | Poor 93.4% |
| Immigrants | Bahamas | 15.2 /100 | #214 | Poor 93.4% |
| Immigrants | Oceania | 15.1 /100 | #215 | Poor 93.4% |
| Immigrants | Eastern Africa | 14.7 /100 | #216 | Poor 93.4% |