Jamaican vs Immigrants from Germany Single Mother Households
COMPARE
Jamaican
Immigrants from Germany
Single Mother Households
Single Mother Households Comparison
Jamaicans
Immigrants from Germany
8.2%
SINGLE MOTHER HOUSEHOLDS
0.0/ 100
METRIC RATING
319th/ 347
METRIC RANK
6.1%
SINGLE MOTHER HOUSEHOLDS
72.4/ 100
METRIC RATING
161st/ 347
METRIC RANK
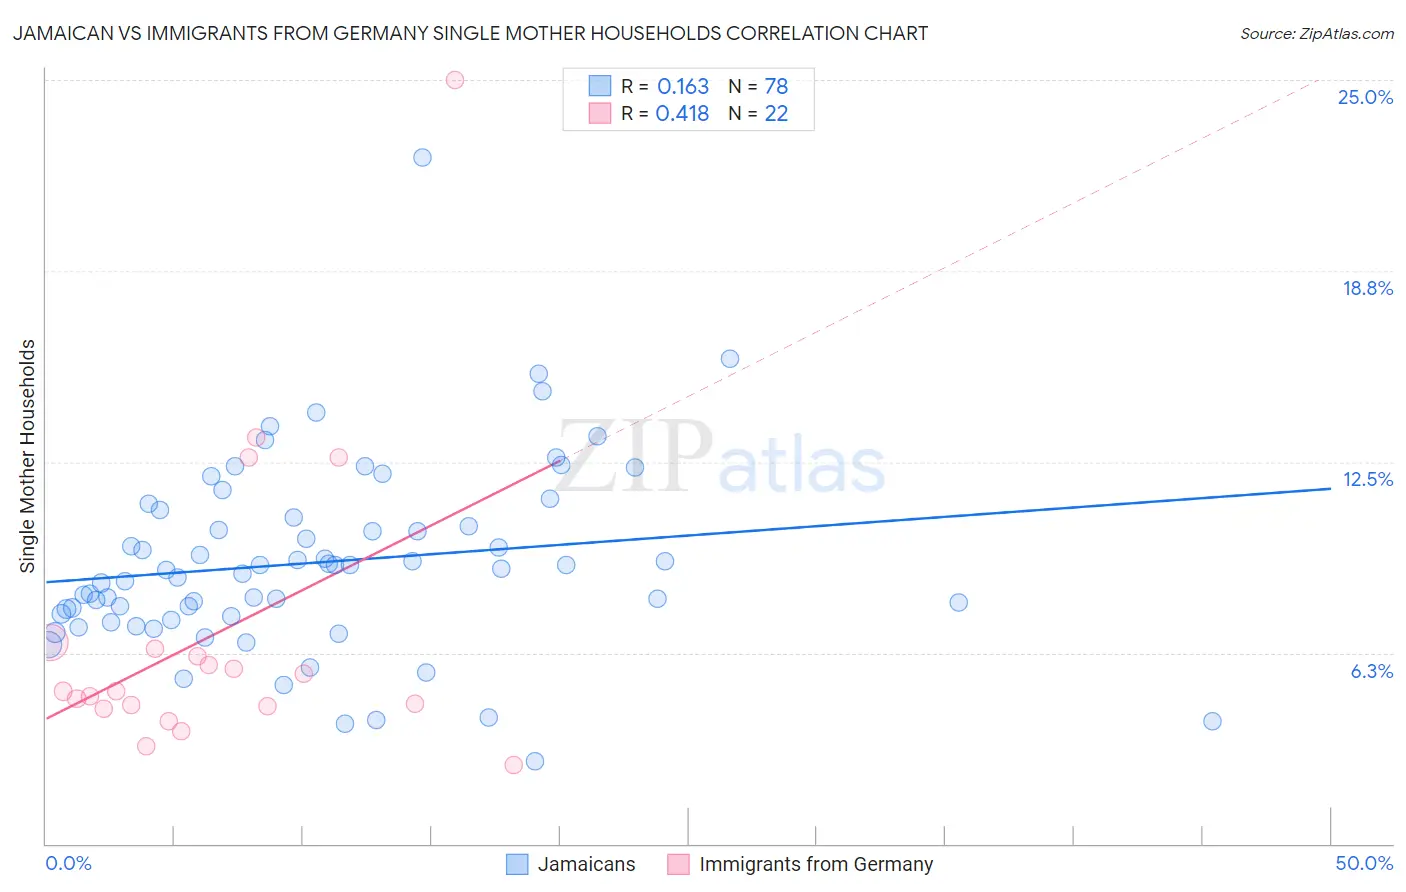
Jamaican vs Immigrants from Germany Single Mother Households Correlation Chart
The statistical analysis conducted on geographies consisting of 367,100,383 people shows a poor positive correlation between the proportion of Jamaicans and percentage of single mother households in the United States with a correlation coefficient (R) of 0.163 and weighted average of 8.2%. Similarly, the statistical analysis conducted on geographies consisting of 462,130,920 people shows a moderate positive correlation between the proportion of Immigrants from Germany and percentage of single mother households in the United States with a correlation coefficient (R) of 0.418 and weighted average of 6.1%, a difference of 34.2%.
Single Mother Households Correlation Summary
| Measurement | Jamaican | Immigrants from Germany |
| Minimum | 2.7% | 2.6% |
| Maximum | 22.5% | 25.0% |
| Range | 19.8% | 22.4% |
| Mean | 9.2% | 6.9% |
| Median | 9.0% | 5.0% |
| Interquartile 25% (IQ1) | 7.4% | 4.5% |
| Interquartile 75% (IQ3) | 10.7% | 6.4% |
| Interquartile Range (IQR) | 3.2% | 1.9% |
| Standard Deviation (Sample) | 3.1% | 5.0% |
| Standard Deviation (Population) | 3.1% | 4.9% |
Similar Demographics by Single Mother Households
Demographics Similar to Jamaicans by Single Mother Households
In terms of single mother households, the demographic groups most similar to Jamaicans are Senegalese (8.2%, a difference of 0.11%), Bahamian (8.3%, a difference of 0.12%), Immigrants from Senegal (8.3%, a difference of 0.36%), Pima (8.3%, a difference of 0.44%), and Immigrants from Honduras (8.2%, a difference of 0.68%).
| Demographics | Rating | Rank | Single Mother Households |
| Bangladeshis | 0.0 /100 | #312 | Tragic 8.1% |
| Immigrants | Grenada | 0.0 /100 | #313 | Tragic 8.2% |
| Immigrants | Mexico | 0.0 /100 | #314 | Tragic 8.2% |
| Immigrants | Western Africa | 0.0 /100 | #315 | Tragic 8.2% |
| Africans | 0.0 /100 | #316 | Tragic 8.2% |
| Immigrants | Honduras | 0.0 /100 | #317 | Tragic 8.2% |
| Senegalese | 0.0 /100 | #318 | Tragic 8.2% |
| Jamaicans | 0.0 /100 | #319 | Tragic 8.2% |
| Bahamians | 0.0 /100 | #320 | Tragic 8.3% |
| Immigrants | Senegal | 0.0 /100 | #321 | Tragic 8.3% |
| Pima | 0.0 /100 | #322 | Tragic 8.3% |
| Haitians | 0.0 /100 | #323 | Tragic 8.3% |
| Immigrants | Jamaica | 0.0 /100 | #324 | Tragic 8.4% |
| Immigrants | Caribbean | 0.0 /100 | #325 | Tragic 8.4% |
| British West Indians | 0.0 /100 | #326 | Tragic 8.4% |
Demographics Similar to Immigrants from Germany by Single Mother Households
In terms of single mother households, the demographic groups most similar to Immigrants from Germany are Iraqi (6.1%, a difference of 0.080%), Yugoslavian (6.1%, a difference of 0.090%), Celtic (6.1%, a difference of 0.13%), Chilean (6.1%, a difference of 0.27%), and Immigrants from Zimbabwe (6.2%, a difference of 0.34%).
| Demographics | Rating | Rank | Single Mother Households |
| Immigrants | Philippines | 78.5 /100 | #154 | Good 6.1% |
| Whites/Caucasians | 76.5 /100 | #155 | Good 6.1% |
| Native Hawaiians | 75.0 /100 | #156 | Good 6.1% |
| Chileans | 74.2 /100 | #157 | Good 6.1% |
| Celtics | 73.3 /100 | #158 | Good 6.1% |
| Yugoslavians | 73.1 /100 | #159 | Good 6.1% |
| Iraqis | 73.0 /100 | #160 | Good 6.1% |
| Immigrants | Germany | 72.4 /100 | #161 | Good 6.1% |
| Immigrants | Zimbabwe | 69.9 /100 | #162 | Good 6.2% |
| Alsatians | 68.7 /100 | #163 | Good 6.2% |
| Immigrants | Northern Africa | 68.0 /100 | #164 | Good 6.2% |
| Immigrants | Syria | 67.4 /100 | #165 | Good 6.2% |
| Sri Lankans | 63.9 /100 | #166 | Good 6.2% |
| Brazilians | 59.1 /100 | #167 | Average 6.2% |
| Immigrants | Chile | 58.3 /100 | #168 | Average 6.3% |