Yuman vs Immigrants from Chile Single Mother Households
COMPARE
Yuman
Immigrants from Chile
Single Mother Households
Single Mother Households Comparison
Yuman
Immigrants from Chile
9.6%
SINGLE MOTHER HOUSEHOLDS
0.0/ 100
METRIC RATING
346th/ 347
METRIC RANK
6.3%
SINGLE MOTHER HOUSEHOLDS
58.3/ 100
METRIC RATING
168th/ 347
METRIC RANK
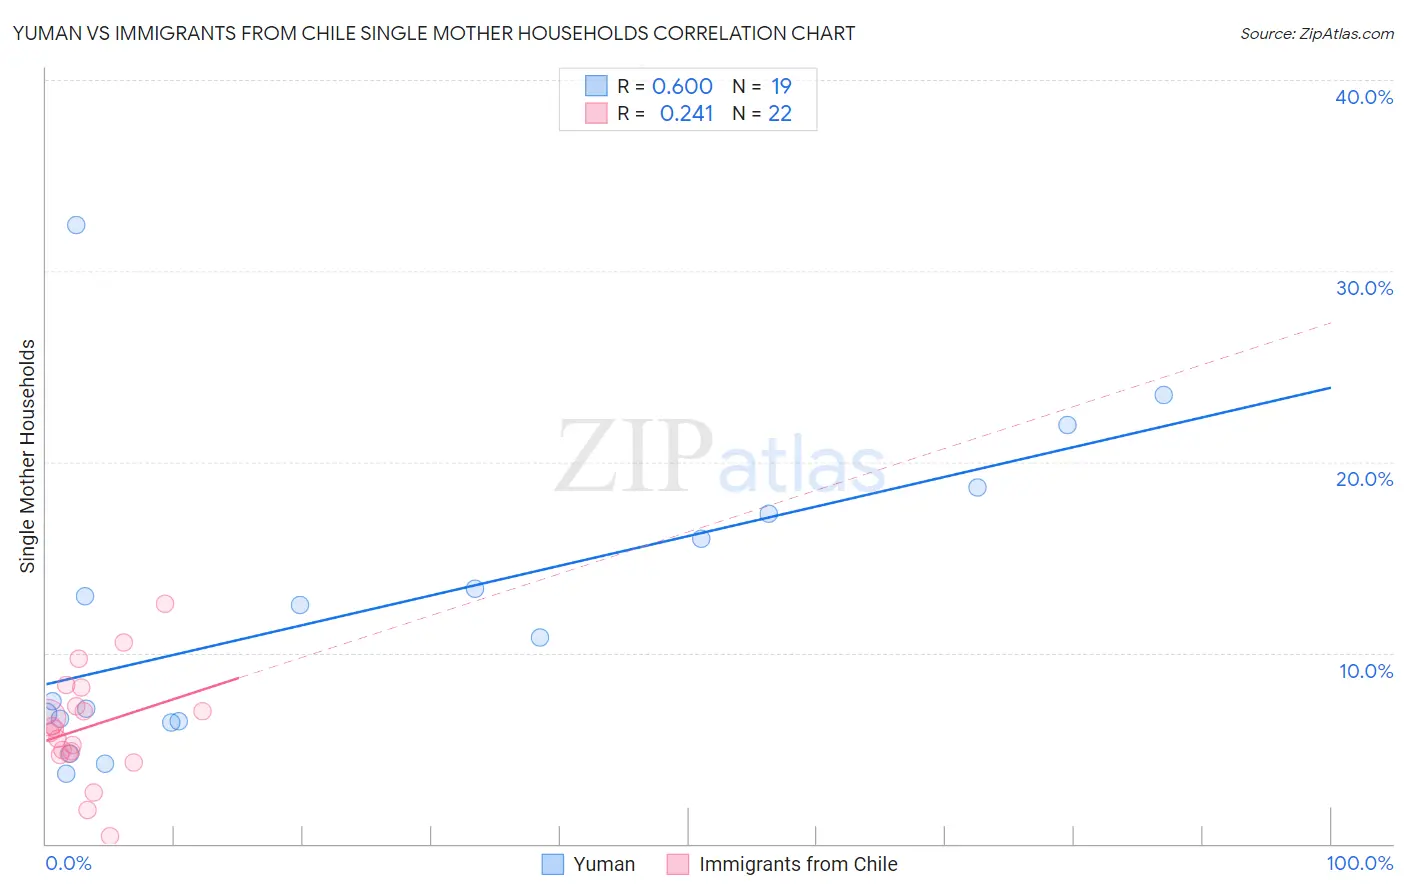
Yuman vs Immigrants from Chile Single Mother Households Correlation Chart
The statistical analysis conducted on geographies consisting of 40,651,175 people shows a significant positive correlation between the proportion of Yuman and percentage of single mother households in the United States with a correlation coefficient (R) of 0.600 and weighted average of 9.6%. Similarly, the statistical analysis conducted on geographies consisting of 218,462,093 people shows a weak positive correlation between the proportion of Immigrants from Chile and percentage of single mother households in the United States with a correlation coefficient (R) of 0.241 and weighted average of 6.3%, a difference of 54.1%.
Single Mother Households Correlation Summary
| Measurement | Yuman | Immigrants from Chile |
| Minimum | 3.7% | 0.42% |
| Maximum | 32.4% | 12.6% |
| Range | 28.7% | 12.2% |
| Mean | 12.2% | 6.1% |
| Median | 10.8% | 5.9% |
| Interquartile 25% (IQ1) | 6.4% | 4.7% |
| Interquartile 75% (IQ3) | 17.3% | 7.2% |
| Interquartile Range (IQR) | 10.8% | 2.5% |
| Standard Deviation (Sample) | 7.8% | 2.8% |
| Standard Deviation (Population) | 7.6% | 2.7% |
Similar Demographics by Single Mother Households
Demographics Similar to Yuman by Single Mother Households
In terms of single mother households, the demographic groups most similar to Yuman are Immigrants from Cabo Verde (9.6%, a difference of 0.59%), Immigrants from Dominican Republic (9.5%, a difference of 1.4%), Yup'ik (10.0%, a difference of 3.8%), Dominican (9.2%, a difference of 4.9%), and Menominee (9.2%, a difference of 5.2%).
| Demographics | Rating | Rank | Single Mother Households |
| Liberians | 0.0 /100 | #333 | Tragic 8.6% |
| Immigrants | Liberia | 0.0 /100 | #334 | Tragic 8.7% |
| Immigrants | Dominica | 0.0 /100 | #335 | Tragic 8.7% |
| Puerto Ricans | 0.0 /100 | #336 | Tragic 8.7% |
| Navajo | 0.0 /100 | #337 | Tragic 8.8% |
| Cape Verdeans | 0.0 /100 | #338 | Tragic 8.9% |
| Blacks/African Americans | 0.0 /100 | #339 | Tragic 9.0% |
| Lumbee | 0.0 /100 | #340 | Tragic 9.1% |
| Tohono O'odham | 0.0 /100 | #341 | Tragic 9.1% |
| Menominee | 0.0 /100 | #342 | Tragic 9.2% |
| Dominicans | 0.0 /100 | #343 | Tragic 9.2% |
| Immigrants | Dominican Republic | 0.0 /100 | #344 | Tragic 9.5% |
| Immigrants | Cabo Verde | 0.0 /100 | #345 | Tragic 9.6% |
| Yuman | 0.0 /100 | #346 | Tragic 9.6% |
| Yup'ik | 0.0 /100 | #347 | Tragic 10.0% |
Demographics Similar to Immigrants from Chile by Single Mother Households
In terms of single mother households, the demographic groups most similar to Immigrants from Chile are Puget Sound Salish (6.3%, a difference of 0.020%), Brazilian (6.2%, a difference of 0.090%), Immigrants from Oceania (6.3%, a difference of 0.42%), Sri Lankan (6.2%, a difference of 0.65%), and Afghan (6.3%, a difference of 0.65%).
| Demographics | Rating | Rank | Single Mother Households |
| Immigrants | Germany | 72.4 /100 | #161 | Good 6.1% |
| Immigrants | Zimbabwe | 69.9 /100 | #162 | Good 6.2% |
| Alsatians | 68.7 /100 | #163 | Good 6.2% |
| Immigrants | Northern Africa | 68.0 /100 | #164 | Good 6.2% |
| Immigrants | Syria | 67.4 /100 | #165 | Good 6.2% |
| Sri Lankans | 63.9 /100 | #166 | Good 6.2% |
| Brazilians | 59.1 /100 | #167 | Average 6.2% |
| Immigrants | Chile | 58.3 /100 | #168 | Average 6.3% |
| Puget Sound Salish | 58.1 /100 | #169 | Average 6.3% |
| Immigrants | Oceania | 54.6 /100 | #170 | Average 6.3% |
| Afghans | 52.5 /100 | #171 | Average 6.3% |
| Immigrants | South Eastern Asia | 52.2 /100 | #172 | Average 6.3% |
| Immigrants | Vietnam | 51.5 /100 | #173 | Average 6.3% |
| Immigrants | Morocco | 50.0 /100 | #174 | Average 6.3% |
| Marshallese | 45.8 /100 | #175 | Average 6.3% |