Jamaican vs Barbadian Single Mother Households
COMPARE
Jamaican
Barbadian
Single Mother Households
Single Mother Households Comparison
Jamaicans
Barbadians
8.2%
SINGLE MOTHER HOUSEHOLDS
0.0/ 100
METRIC RATING
319th/ 347
METRIC RANK
7.9%
SINGLE MOTHER HOUSEHOLDS
0.0/ 100
METRIC RATING
295th/ 347
METRIC RANK
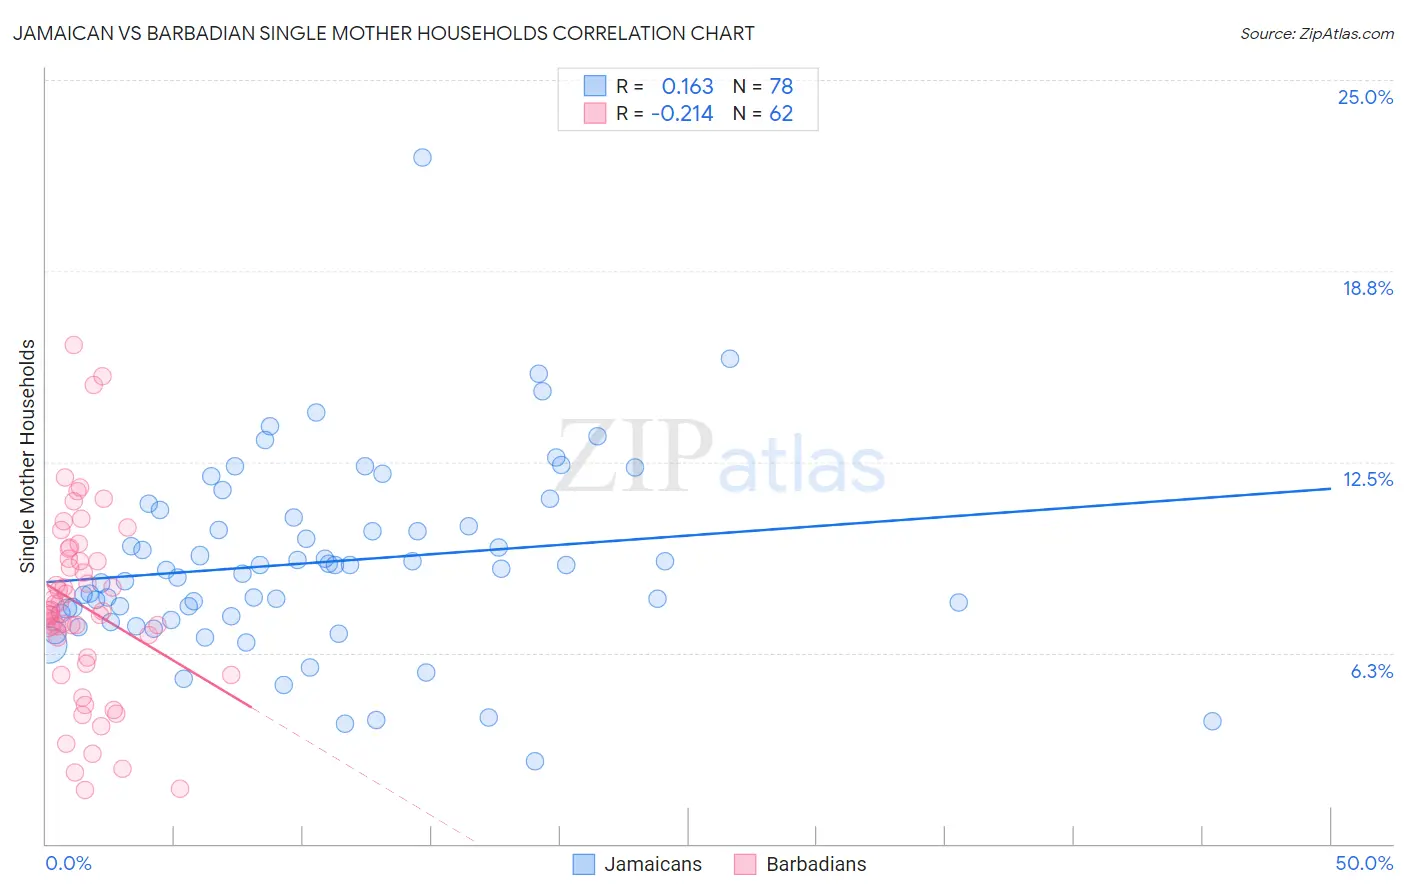
Jamaican vs Barbadian Single Mother Households Correlation Chart
The statistical analysis conducted on geographies consisting of 367,100,383 people shows a poor positive correlation between the proportion of Jamaicans and percentage of single mother households in the United States with a correlation coefficient (R) of 0.163 and weighted average of 8.2%. Similarly, the statistical analysis conducted on geographies consisting of 141,217,581 people shows a weak negative correlation between the proportion of Barbadians and percentage of single mother households in the United States with a correlation coefficient (R) of -0.214 and weighted average of 7.9%, a difference of 4.3%.
Single Mother Households Correlation Summary
| Measurement | Jamaican | Barbadian |
| Minimum | 2.7% | 1.8% |
| Maximum | 22.5% | 16.3% |
| Range | 19.8% | 14.6% |
| Mean | 9.2% | 7.8% |
| Median | 9.0% | 7.6% |
| Interquartile 25% (IQ1) | 7.4% | 6.1% |
| Interquartile 75% (IQ3) | 10.7% | 9.3% |
| Interquartile Range (IQR) | 3.2% | 3.2% |
| Standard Deviation (Sample) | 3.1% | 3.1% |
| Standard Deviation (Population) | 3.1% | 3.0% |
Similar Demographics by Single Mother Households
Demographics Similar to Jamaicans by Single Mother Households
In terms of single mother households, the demographic groups most similar to Jamaicans are Senegalese (8.2%, a difference of 0.11%), Bahamian (8.3%, a difference of 0.12%), Immigrants from Senegal (8.3%, a difference of 0.36%), Pima (8.3%, a difference of 0.44%), and Immigrants from Honduras (8.2%, a difference of 0.68%).
| Demographics | Rating | Rank | Single Mother Households |
| Bangladeshis | 0.0 /100 | #312 | Tragic 8.1% |
| Immigrants | Grenada | 0.0 /100 | #313 | Tragic 8.2% |
| Immigrants | Mexico | 0.0 /100 | #314 | Tragic 8.2% |
| Immigrants | Western Africa | 0.0 /100 | #315 | Tragic 8.2% |
| Africans | 0.0 /100 | #316 | Tragic 8.2% |
| Immigrants | Honduras | 0.0 /100 | #317 | Tragic 8.2% |
| Senegalese | 0.0 /100 | #318 | Tragic 8.2% |
| Jamaicans | 0.0 /100 | #319 | Tragic 8.2% |
| Bahamians | 0.0 /100 | #320 | Tragic 8.3% |
| Immigrants | Senegal | 0.0 /100 | #321 | Tragic 8.3% |
| Pima | 0.0 /100 | #322 | Tragic 8.3% |
| Haitians | 0.0 /100 | #323 | Tragic 8.3% |
| Immigrants | Jamaica | 0.0 /100 | #324 | Tragic 8.4% |
| Immigrants | Caribbean | 0.0 /100 | #325 | Tragic 8.4% |
| British West Indians | 0.0 /100 | #326 | Tragic 8.4% |
Demographics Similar to Barbadians by Single Mother Households
In terms of single mother households, the demographic groups most similar to Barbadians are Immigrants from Latin America (7.9%, a difference of 0.060%), Hispanic or Latino (7.9%, a difference of 0.10%), Immigrants from West Indies (7.9%, a difference of 0.22%), Apache (7.9%, a difference of 0.29%), and Houma (7.9%, a difference of 0.30%).
| Demographics | Rating | Rank | Single Mother Households |
| Sierra Leoneans | 0.0 /100 | #288 | Tragic 7.7% |
| Sub-Saharan Africans | 0.0 /100 | #289 | Tragic 7.8% |
| Immigrants | Nigeria | 0.0 /100 | #290 | Tragic 7.8% |
| West Indians | 0.0 /100 | #291 | Tragic 7.8% |
| Ghanaians | 0.0 /100 | #292 | Tragic 7.8% |
| Immigrants | Cameroon | 0.0 /100 | #293 | Tragic 7.9% |
| Apache | 0.0 /100 | #294 | Tragic 7.9% |
| Barbadians | 0.0 /100 | #295 | Tragic 7.9% |
| Immigrants | Latin America | 0.0 /100 | #296 | Tragic 7.9% |
| Hispanics or Latinos | 0.0 /100 | #297 | Tragic 7.9% |
| Immigrants | West Indies | 0.0 /100 | #298 | Tragic 7.9% |
| Houma | 0.0 /100 | #299 | Tragic 7.9% |
| Mexicans | 0.0 /100 | #300 | Tragic 8.0% |
| Chippewa | 0.0 /100 | #301 | Tragic 8.0% |
| Immigrants | Ghana | 0.0 /100 | #302 | Tragic 8.0% |