Canadian vs Immigrants from Chile Single Mother Households
COMPARE
Canadian
Immigrants from Chile
Single Mother Households
Single Mother Households Comparison
Canadians
Immigrants from Chile
5.9%
SINGLE MOTHER HOUSEHOLDS
90.5/ 100
METRIC RATING
134th/ 347
METRIC RANK
6.3%
SINGLE MOTHER HOUSEHOLDS
58.3/ 100
METRIC RATING
168th/ 347
METRIC RANK
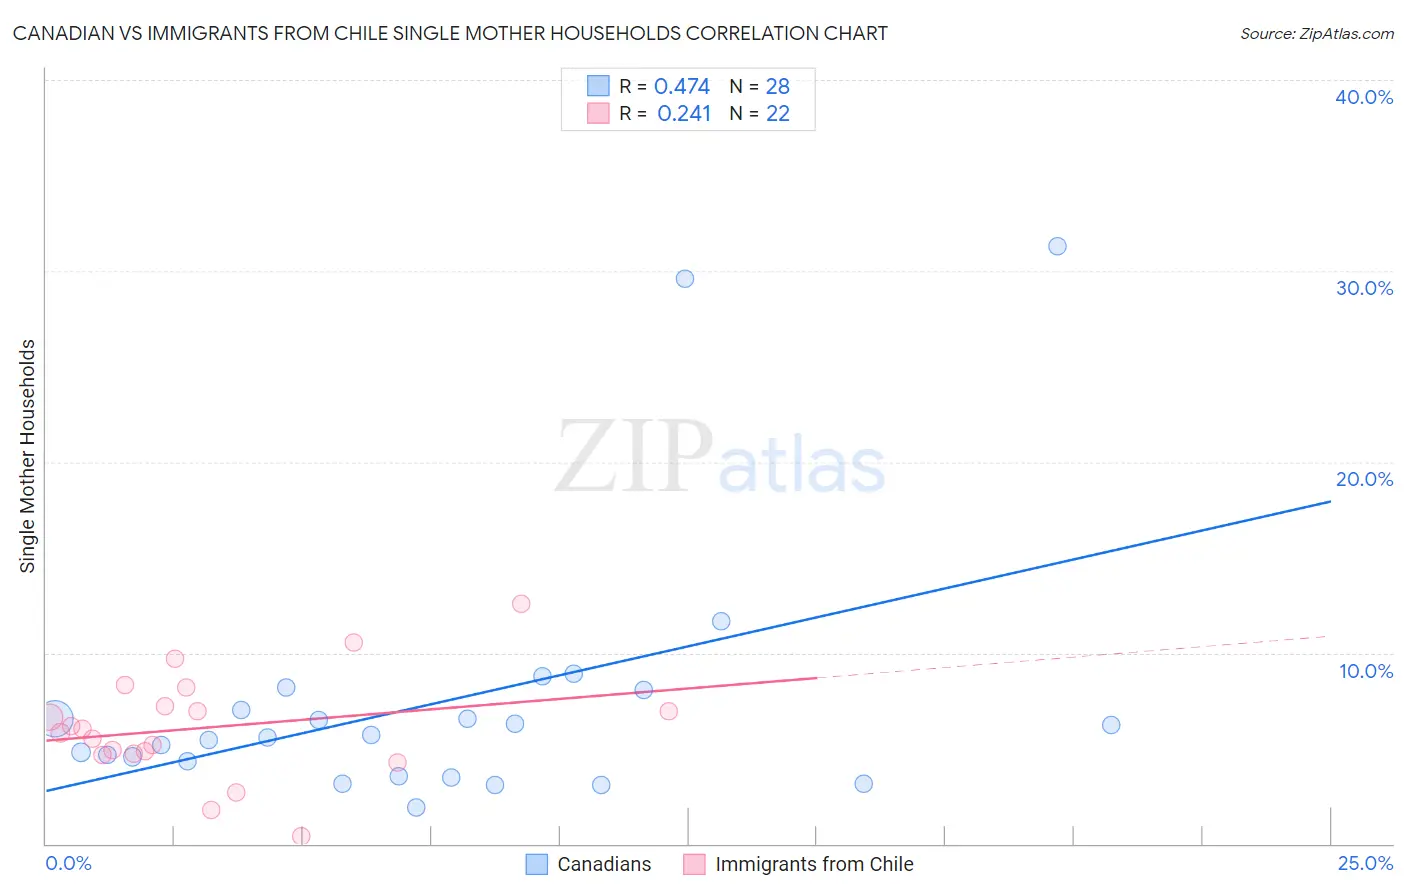
Canadian vs Immigrants from Chile Single Mother Households Correlation Chart
The statistical analysis conducted on geographies consisting of 435,747,557 people shows a moderate positive correlation between the proportion of Canadians and percentage of single mother households in the United States with a correlation coefficient (R) of 0.474 and weighted average of 5.9%. Similarly, the statistical analysis conducted on geographies consisting of 218,462,093 people shows a weak positive correlation between the proportion of Immigrants from Chile and percentage of single mother households in the United States with a correlation coefficient (R) of 0.241 and weighted average of 6.3%, a difference of 5.6%.
Single Mother Households Correlation Summary
| Measurement | Canadian | Immigrants from Chile |
| Minimum | 1.9% | 0.42% |
| Maximum | 31.3% | 12.6% |
| Range | 29.4% | 12.2% |
| Mean | 7.4% | 6.1% |
| Median | 5.7% | 5.9% |
| Interquartile 25% (IQ1) | 3.9% | 4.7% |
| Interquartile 75% (IQ3) | 7.6% | 7.2% |
| Interquartile Range (IQR) | 3.6% | 2.5% |
| Standard Deviation (Sample) | 6.9% | 2.8% |
| Standard Deviation (Population) | 6.7% | 2.7% |
Similar Demographics by Single Mother Households
Demographics Similar to Canadians by Single Mother Households
In terms of single mother households, the demographic groups most similar to Canadians are Egyptian (5.9%, a difference of 0.060%), Immigrants from Saudi Arabia (5.9%, a difference of 0.090%), Albanian (5.9%, a difference of 0.22%), Immigrants from Spain (5.9%, a difference of 0.26%), and Jordanian (6.0%, a difference of 0.51%).
| Demographics | Rating | Rank | Single Mother Households |
| Lebanese | 92.4 /100 | #127 | Exceptional 5.9% |
| Czechoslovakians | 92.2 /100 | #128 | Exceptional 5.9% |
| Immigrants | Bolivia | 92.2 /100 | #129 | Exceptional 5.9% |
| Palestinians | 92.1 /100 | #130 | Exceptional 5.9% |
| Immigrants | Spain | 91.2 /100 | #131 | Exceptional 5.9% |
| Albanians | 91.1 /100 | #132 | Exceptional 5.9% |
| Egyptians | 90.7 /100 | #133 | Exceptional 5.9% |
| Canadians | 90.5 /100 | #134 | Exceptional 5.9% |
| Immigrants | Saudi Arabia | 90.2 /100 | #135 | Exceptional 5.9% |
| Jordanians | 88.9 /100 | #136 | Excellent 6.0% |
| Immigrants | Pakistan | 88.4 /100 | #137 | Excellent 6.0% |
| Icelanders | 86.9 /100 | #138 | Excellent 6.0% |
| Syrians | 86.0 /100 | #139 | Excellent 6.0% |
| French | 85.7 /100 | #140 | Excellent 6.0% |
| Tsimshian | 85.2 /100 | #141 | Excellent 6.0% |
Demographics Similar to Immigrants from Chile by Single Mother Households
In terms of single mother households, the demographic groups most similar to Immigrants from Chile are Puget Sound Salish (6.3%, a difference of 0.020%), Brazilian (6.2%, a difference of 0.090%), Immigrants from Oceania (6.3%, a difference of 0.42%), Sri Lankan (6.2%, a difference of 0.65%), and Afghan (6.3%, a difference of 0.65%).
| Demographics | Rating | Rank | Single Mother Households |
| Immigrants | Germany | 72.4 /100 | #161 | Good 6.1% |
| Immigrants | Zimbabwe | 69.9 /100 | #162 | Good 6.2% |
| Alsatians | 68.7 /100 | #163 | Good 6.2% |
| Immigrants | Northern Africa | 68.0 /100 | #164 | Good 6.2% |
| Immigrants | Syria | 67.4 /100 | #165 | Good 6.2% |
| Sri Lankans | 63.9 /100 | #166 | Good 6.2% |
| Brazilians | 59.1 /100 | #167 | Average 6.2% |
| Immigrants | Chile | 58.3 /100 | #168 | Average 6.3% |
| Puget Sound Salish | 58.1 /100 | #169 | Average 6.3% |
| Immigrants | Oceania | 54.6 /100 | #170 | Average 6.3% |
| Afghans | 52.5 /100 | #171 | Average 6.3% |
| Immigrants | South Eastern Asia | 52.2 /100 | #172 | Average 6.3% |
| Immigrants | Vietnam | 51.5 /100 | #173 | Average 6.3% |
| Immigrants | Morocco | 50.0 /100 | #174 | Average 6.3% |
| Marshallese | 45.8 /100 | #175 | Average 6.3% |