Tlingit-Haida vs Immigrants from Chile Single Mother Households
COMPARE
Tlingit-Haida
Immigrants from Chile
Single Mother Households
Single Mother Households Comparison
Tlingit-Haida
Immigrants from Chile
5.7%
SINGLE MOTHER HOUSEHOLDS
96.4/ 100
METRIC RATING
97th/ 347
METRIC RANK
6.3%
SINGLE MOTHER HOUSEHOLDS
58.3/ 100
METRIC RATING
168th/ 347
METRIC RANK
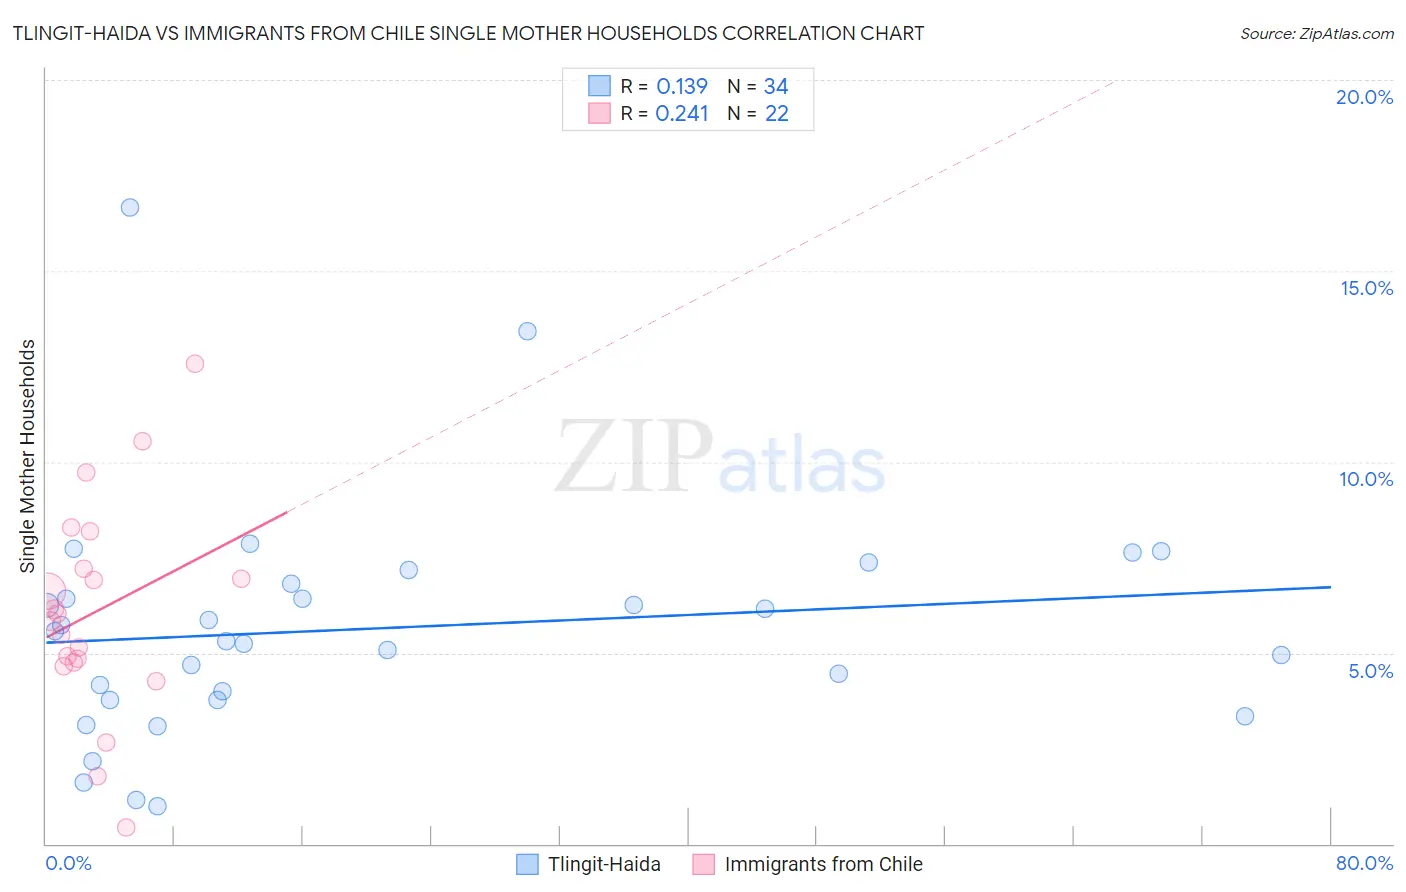
Tlingit-Haida vs Immigrants from Chile Single Mother Households Correlation Chart
The statistical analysis conducted on geographies consisting of 60,822,631 people shows a poor positive correlation between the proportion of Tlingit-Haida and percentage of single mother households in the United States with a correlation coefficient (R) of 0.139 and weighted average of 5.7%. Similarly, the statistical analysis conducted on geographies consisting of 218,462,093 people shows a weak positive correlation between the proportion of Immigrants from Chile and percentage of single mother households in the United States with a correlation coefficient (R) of 0.241 and weighted average of 6.3%, a difference of 8.8%.
Single Mother Households Correlation Summary
| Measurement | Tlingit-Haida | Immigrants from Chile |
| Minimum | 0.98% | 0.42% |
| Maximum | 16.7% | 12.6% |
| Range | 15.7% | 12.2% |
| Mean | 5.6% | 6.1% |
| Median | 5.4% | 5.9% |
| Interquartile 25% (IQ1) | 3.8% | 4.7% |
| Interquartile 75% (IQ3) | 6.8% | 7.2% |
| Interquartile Range (IQR) | 3.0% | 2.5% |
| Standard Deviation (Sample) | 3.1% | 2.8% |
| Standard Deviation (Population) | 3.0% | 2.7% |
Similar Demographics by Single Mother Households
Demographics Similar to Tlingit-Haida by Single Mother Households
In terms of single mother households, the demographic groups most similar to Tlingit-Haida are Immigrants from South Africa (5.7%, a difference of 0.040%), Austrian (5.7%, a difference of 0.050%), Immigrants from Poland (5.8%, a difference of 0.10%), Scandinavian (5.8%, a difference of 0.11%), and German (5.8%, a difference of 0.14%).
| Demographics | Rating | Rank | Single Mother Households |
| Immigrants | Indonesia | 97.2 /100 | #90 | Exceptional 5.7% |
| Europeans | 97.0 /100 | #91 | Exceptional 5.7% |
| Immigrants | Western Asia | 96.7 /100 | #92 | Exceptional 5.7% |
| Serbians | 96.7 /100 | #93 | Exceptional 5.7% |
| Basques | 96.7 /100 | #94 | Exceptional 5.7% |
| Slovaks | 96.6 /100 | #95 | Exceptional 5.7% |
| Austrians | 96.4 /100 | #96 | Exceptional 5.7% |
| Tlingit-Haida | 96.4 /100 | #97 | Exceptional 5.7% |
| Immigrants | South Africa | 96.3 /100 | #98 | Exceptional 5.7% |
| Immigrants | Poland | 96.3 /100 | #99 | Exceptional 5.8% |
| Scandinavians | 96.2 /100 | #100 | Exceptional 5.8% |
| Germans | 96.2 /100 | #101 | Exceptional 5.8% |
| English | 96.2 /100 | #102 | Exceptional 5.8% |
| Scottish | 96.2 /100 | #103 | Exceptional 5.8% |
| Northern Europeans | 96.2 /100 | #104 | Exceptional 5.8% |
Demographics Similar to Immigrants from Chile by Single Mother Households
In terms of single mother households, the demographic groups most similar to Immigrants from Chile are Puget Sound Salish (6.3%, a difference of 0.020%), Brazilian (6.2%, a difference of 0.090%), Immigrants from Oceania (6.3%, a difference of 0.42%), Sri Lankan (6.2%, a difference of 0.65%), and Afghan (6.3%, a difference of 0.65%).
| Demographics | Rating | Rank | Single Mother Households |
| Immigrants | Germany | 72.4 /100 | #161 | Good 6.1% |
| Immigrants | Zimbabwe | 69.9 /100 | #162 | Good 6.2% |
| Alsatians | 68.7 /100 | #163 | Good 6.2% |
| Immigrants | Northern Africa | 68.0 /100 | #164 | Good 6.2% |
| Immigrants | Syria | 67.4 /100 | #165 | Good 6.2% |
| Sri Lankans | 63.9 /100 | #166 | Good 6.2% |
| Brazilians | 59.1 /100 | #167 | Average 6.2% |
| Immigrants | Chile | 58.3 /100 | #168 | Average 6.3% |
| Puget Sound Salish | 58.1 /100 | #169 | Average 6.3% |
| Immigrants | Oceania | 54.6 /100 | #170 | Average 6.3% |
| Afghans | 52.5 /100 | #171 | Average 6.3% |
| Immigrants | South Eastern Asia | 52.2 /100 | #172 | Average 6.3% |
| Immigrants | Vietnam | 51.5 /100 | #173 | Average 6.3% |
| Immigrants | Morocco | 50.0 /100 | #174 | Average 6.3% |
| Marshallese | 45.8 /100 | #175 | Average 6.3% |