Burmese vs Armenian Currently Married
COMPARE
Burmese
Armenian
Currently Married
Currently Married Comparison
Burmese
Armenians
48.9%
CURRENTLY MARRIED
99.6/ 100
METRIC RATING
27th/ 347
METRIC RANK
46.8%
CURRENTLY MARRIED
58.2/ 100
METRIC RATING
169th/ 347
METRIC RANK
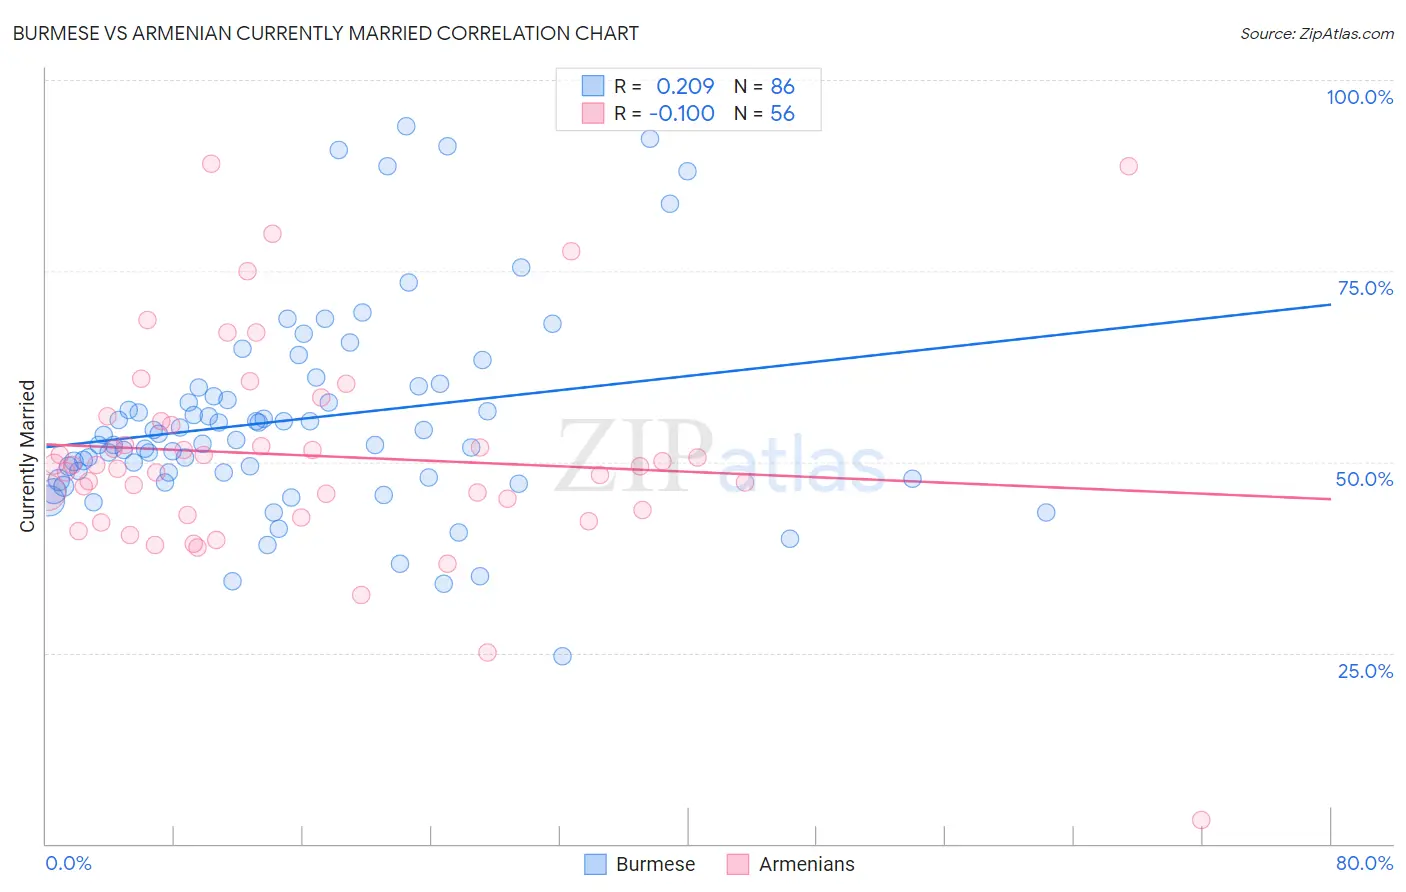
Burmese vs Armenian Currently Married Correlation Chart
The statistical analysis conducted on geographies consisting of 465,297,934 people shows a weak positive correlation between the proportion of Burmese and percentage of population currently married in the United States with a correlation coefficient (R) of 0.209 and weighted average of 48.9%. Similarly, the statistical analysis conducted on geographies consisting of 310,938,926 people shows a poor negative correlation between the proportion of Armenians and percentage of population currently married in the United States with a correlation coefficient (R) of -0.100 and weighted average of 46.8%, a difference of 4.6%.
Currently Married Correlation Summary
| Measurement | Burmese | Armenian |
| Minimum | 24.6% | 3.1% |
| Maximum | 93.9% | 89.1% |
| Range | 69.3% | 86.0% |
| Mean | 55.6% | 50.8% |
| Median | 53.2% | 49.5% |
| Interquartile 25% (IQ1) | 48.0% | 43.4% |
| Interquartile 75% (IQ3) | 59.7% | 55.1% |
| Interquartile Range (IQR) | 11.7% | 11.7% |
| Standard Deviation (Sample) | 13.6% | 14.2% |
| Standard Deviation (Population) | 13.5% | 14.0% |
Similar Demographics by Currently Married
Demographics Similar to Burmese by Currently Married
In terms of currently married, the demographic groups most similar to Burmese are Welsh (48.9%, a difference of 0.040%), Immigrants from Korea (49.0%, a difference of 0.070%), Croatian (48.9%, a difference of 0.090%), Eastern European (48.9%, a difference of 0.10%), and Polish (48.9%, a difference of 0.10%).
| Demographics | Rating | Rank | Currently Married |
| Luxembourgers | 99.8 /100 | #20 | Exceptional 49.3% |
| Scottish | 99.8 /100 | #21 | Exceptional 49.2% |
| Bulgarians | 99.7 /100 | #22 | Exceptional 49.1% |
| Immigrants | Pakistan | 99.7 /100 | #23 | Exceptional 49.1% |
| Lithuanians | 99.6 /100 | #24 | Exceptional 49.0% |
| Maltese | 99.6 /100 | #25 | Exceptional 49.0% |
| Immigrants | Korea | 99.6 /100 | #26 | Exceptional 49.0% |
| Burmese | 99.6 /100 | #27 | Exceptional 48.9% |
| Welsh | 99.5 /100 | #28 | Exceptional 48.9% |
| Croatians | 99.5 /100 | #29 | Exceptional 48.9% |
| Eastern Europeans | 99.5 /100 | #30 | Exceptional 48.9% |
| Poles | 99.5 /100 | #31 | Exceptional 48.9% |
| Immigrants | Hong Kong | 99.5 /100 | #32 | Exceptional 48.9% |
| Irish | 99.5 /100 | #33 | Exceptional 48.9% |
| Immigrants | Lithuania | 99.4 /100 | #34 | Exceptional 48.8% |
Demographics Similar to Armenians by Currently Married
In terms of currently married, the demographic groups most similar to Armenians are Immigrants from Afghanistan (46.8%, a difference of 0.0%), Spaniard (46.8%, a difference of 0.020%), Immigrants from Syria (46.8%, a difference of 0.040%), Immigrants from Latvia (46.7%, a difference of 0.050%), and Samoan (46.8%, a difference of 0.060%).
| Demographics | Rating | Rank | Currently Married |
| Immigrants | Nonimmigrants | 65.4 /100 | #162 | Good 46.9% |
| Delaware | 64.7 /100 | #163 | Good 46.9% |
| Immigrants | Western Asia | 64.2 /100 | #164 | Good 46.9% |
| Samoans | 59.8 /100 | #165 | Average 46.8% |
| Immigrants | Syria | 59.3 /100 | #166 | Average 46.8% |
| Spaniards | 58.8 /100 | #167 | Average 46.8% |
| Immigrants | Afghanistan | 58.2 /100 | #168 | Average 46.8% |
| Armenians | 58.2 /100 | #169 | Average 46.8% |
| Immigrants | Latvia | 56.7 /100 | #170 | Average 46.7% |
| Immigrants | Zimbabwe | 52.4 /100 | #171 | Average 46.7% |
| Aleuts | 52.0 /100 | #172 | Average 46.7% |
| Tlingit-Haida | 51.2 /100 | #173 | Average 46.7% |
| Peruvians | 50.0 /100 | #174 | Average 46.6% |
| Immigrants | Brazil | 49.9 /100 | #175 | Average 46.6% |
| Hawaiians | 48.6 /100 | #176 | Average 46.6% |