Menominee vs Armenian Currently Married
COMPARE
Menominee
Armenian
Currently Married
Currently Married Comparison
Menominee
Armenians
42.3%
CURRENTLY MARRIED
0.0/ 100
METRIC RATING
296th/ 347
METRIC RANK
46.8%
CURRENTLY MARRIED
58.2/ 100
METRIC RATING
169th/ 347
METRIC RANK
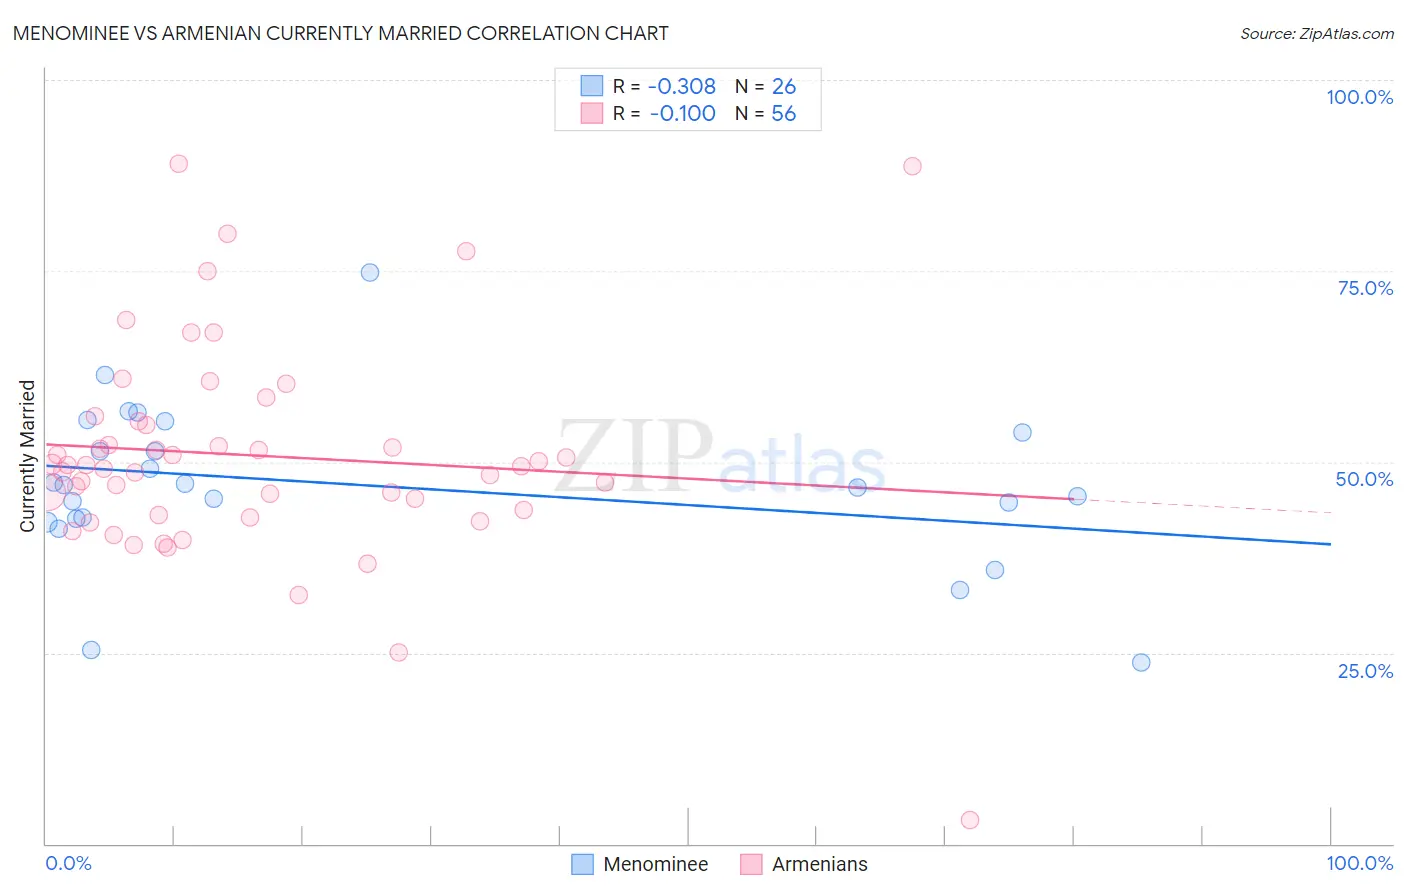
Menominee vs Armenian Currently Married Correlation Chart
The statistical analysis conducted on geographies consisting of 45,778,979 people shows a mild negative correlation between the proportion of Menominee and percentage of population currently married in the United States with a correlation coefficient (R) of -0.308 and weighted average of 42.3%. Similarly, the statistical analysis conducted on geographies consisting of 310,938,926 people shows a poor negative correlation between the proportion of Armenians and percentage of population currently married in the United States with a correlation coefficient (R) of -0.100 and weighted average of 46.8%, a difference of 10.6%.
Currently Married Correlation Summary
| Measurement | Menominee | Armenian |
| Minimum | 23.8% | 3.1% |
| Maximum | 74.8% | 89.1% |
| Range | 51.0% | 86.0% |
| Mean | 47.0% | 50.8% |
| Median | 46.8% | 49.5% |
| Interquartile 25% (IQ1) | 42.5% | 43.4% |
| Interquartile 75% (IQ3) | 53.8% | 55.1% |
| Interquartile Range (IQR) | 11.3% | 11.7% |
| Standard Deviation (Sample) | 10.6% | 14.2% |
| Standard Deviation (Population) | 10.4% | 14.0% |
Similar Demographics by Currently Married
Demographics Similar to Menominee by Currently Married
In terms of currently married, the demographic groups most similar to Menominee are Cheyenne (42.2%, a difference of 0.11%), Immigrants from Honduras (42.2%, a difference of 0.20%), Immigrants from Western Africa (42.4%, a difference of 0.21%), Liberian (42.2%, a difference of 0.23%), and Belizean (42.2%, a difference of 0.33%).
| Demographics | Rating | Rank | Currently Married |
| Paiute | 0.0 /100 | #289 | Tragic 42.7% |
| Immigrants | Ghana | 0.0 /100 | #290 | Tragic 42.7% |
| Immigrants | Guatemala | 0.0 /100 | #291 | Tragic 42.6% |
| Sub-Saharan Africans | 0.0 /100 | #292 | Tragic 42.6% |
| Yuman | 0.0 /100 | #293 | Tragic 42.6% |
| Hondurans | 0.0 /100 | #294 | Tragic 42.5% |
| Immigrants | Western Africa | 0.0 /100 | #295 | Tragic 42.4% |
| Menominee | 0.0 /100 | #296 | Tragic 42.3% |
| Cheyenne | 0.0 /100 | #297 | Tragic 42.2% |
| Immigrants | Honduras | 0.0 /100 | #298 | Tragic 42.2% |
| Liberians | 0.0 /100 | #299 | Tragic 42.2% |
| Belizeans | 0.0 /100 | #300 | Tragic 42.2% |
| Immigrants | Yemen | 0.0 /100 | #301 | Tragic 42.1% |
| Immigrants | Zaire | 0.0 /100 | #302 | Tragic 42.0% |
| Sioux | 0.0 /100 | #303 | Tragic 41.9% |
Demographics Similar to Armenians by Currently Married
In terms of currently married, the demographic groups most similar to Armenians are Immigrants from Afghanistan (46.8%, a difference of 0.0%), Spaniard (46.8%, a difference of 0.020%), Immigrants from Syria (46.8%, a difference of 0.040%), Immigrants from Latvia (46.7%, a difference of 0.050%), and Samoan (46.8%, a difference of 0.060%).
| Demographics | Rating | Rank | Currently Married |
| Immigrants | Nonimmigrants | 65.4 /100 | #162 | Good 46.9% |
| Delaware | 64.7 /100 | #163 | Good 46.9% |
| Immigrants | Western Asia | 64.2 /100 | #164 | Good 46.9% |
| Samoans | 59.8 /100 | #165 | Average 46.8% |
| Immigrants | Syria | 59.3 /100 | #166 | Average 46.8% |
| Spaniards | 58.8 /100 | #167 | Average 46.8% |
| Immigrants | Afghanistan | 58.2 /100 | #168 | Average 46.8% |
| Armenians | 58.2 /100 | #169 | Average 46.8% |
| Immigrants | Latvia | 56.7 /100 | #170 | Average 46.7% |
| Immigrants | Zimbabwe | 52.4 /100 | #171 | Average 46.7% |
| Aleuts | 52.0 /100 | #172 | Average 46.7% |
| Tlingit-Haida | 51.2 /100 | #173 | Average 46.7% |
| Peruvians | 50.0 /100 | #174 | Average 46.6% |
| Immigrants | Brazil | 49.9 /100 | #175 | Average 46.6% |
| Hawaiians | 48.6 /100 | #176 | Average 46.6% |