Jamaican vs Indonesian Currently Married
COMPARE
Jamaican
Indonesian
Currently Married
Currently Married Comparison
Jamaicans
Indonesians
41.4%
CURRENTLY MARRIED
0.0/ 100
METRIC RATING
313th/ 347
METRIC RANK
43.5%
CURRENTLY MARRIED
0.1/ 100
METRIC RATING
272nd/ 347
METRIC RANK
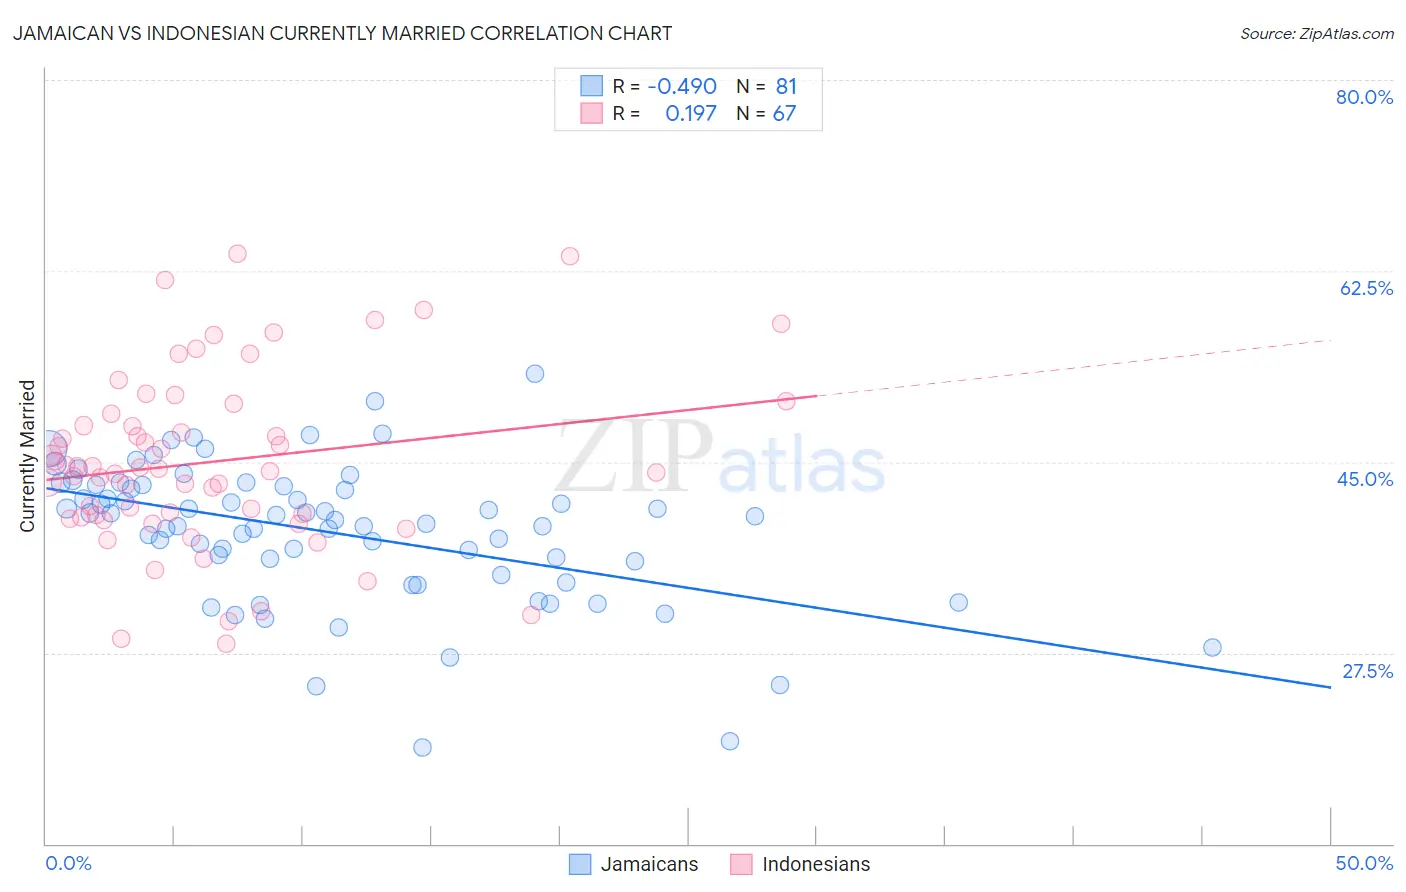
Jamaican vs Indonesian Currently Married Correlation Chart
The statistical analysis conducted on geographies consisting of 368,004,365 people shows a moderate negative correlation between the proportion of Jamaicans and percentage of population currently married in the United States with a correlation coefficient (R) of -0.490 and weighted average of 41.4%. Similarly, the statistical analysis conducted on geographies consisting of 162,724,785 people shows a poor positive correlation between the proportion of Indonesians and percentage of population currently married in the United States with a correlation coefficient (R) of 0.197 and weighted average of 43.5%, a difference of 5.1%.
Currently Married Correlation Summary
| Measurement | Jamaican | Indonesian |
| Minimum | 18.8% | 28.3% |
| Maximum | 53.1% | 64.1% |
| Range | 34.3% | 35.8% |
| Mean | 38.5% | 45.0% |
| Median | 39.6% | 44.3% |
| Interquartile 25% (IQ1) | 35.2% | 39.9% |
| Interquartile 75% (IQ3) | 42.9% | 49.4% |
| Interquartile Range (IQR) | 7.6% | 9.4% |
| Standard Deviation (Sample) | 6.4% | 8.1% |
| Standard Deviation (Population) | 6.4% | 8.0% |
Similar Demographics by Currently Married
Demographics Similar to Jamaicans by Currently Married
In terms of currently married, the demographic groups most similar to Jamaicans are West Indian (41.3%, a difference of 0.080%), Inupiat (41.3%, a difference of 0.16%), Immigrants from Caribbean (41.3%, a difference of 0.22%), Haitian (41.3%, a difference of 0.24%), and Somali (41.5%, a difference of 0.29%).
| Demographics | Rating | Rank | Currently Married |
| Immigrants | Guyana | 0.0 /100 | #306 | Tragic 41.9% |
| Africans | 0.0 /100 | #307 | Tragic 41.8% |
| Immigrants | Belize | 0.0 /100 | #308 | Tragic 41.8% |
| Immigrants | Liberia | 0.0 /100 | #309 | Tragic 41.8% |
| Guyanese | 0.0 /100 | #310 | Tragic 41.6% |
| Trinidadians and Tobagonians | 0.0 /100 | #311 | Tragic 41.5% |
| Somalis | 0.0 /100 | #312 | Tragic 41.5% |
| Jamaicans | 0.0 /100 | #313 | Tragic 41.4% |
| West Indians | 0.0 /100 | #314 | Tragic 41.3% |
| Inupiat | 0.0 /100 | #315 | Tragic 41.3% |
| Immigrants | Caribbean | 0.0 /100 | #316 | Tragic 41.3% |
| Haitians | 0.0 /100 | #317 | Tragic 41.3% |
| Bahamians | 0.0 /100 | #318 | Tragic 41.2% |
| Immigrants | Somalia | 0.0 /100 | #319 | Tragic 41.2% |
| Immigrants | Jamaica | 0.0 /100 | #320 | Tragic 41.1% |
Demographics Similar to Indonesians by Currently Married
In terms of currently married, the demographic groups most similar to Indonesians are Bermudan (43.5%, a difference of 0.040%), Yaqui (43.4%, a difference of 0.040%), Salvadoran (43.5%, a difference of 0.050%), Nigerian (43.4%, a difference of 0.060%), and Colville (43.4%, a difference of 0.080%).
| Demographics | Rating | Rank | Currently Married |
| Immigrants | Bangladesh | 0.1 /100 | #265 | Tragic 43.6% |
| Ecuadorians | 0.1 /100 | #266 | Tragic 43.6% |
| Immigrants | Eritrea | 0.1 /100 | #267 | Tragic 43.6% |
| Spanish American Indians | 0.1 /100 | #268 | Tragic 43.6% |
| Immigrants | Sudan | 0.1 /100 | #269 | Tragic 43.5% |
| Salvadorans | 0.1 /100 | #270 | Tragic 43.5% |
| Bermudans | 0.1 /100 | #271 | Tragic 43.5% |
| Indonesians | 0.1 /100 | #272 | Tragic 43.5% |
| Yaqui | 0.1 /100 | #273 | Tragic 43.4% |
| Nigerians | 0.1 /100 | #274 | Tragic 43.4% |
| Colville | 0.1 /100 | #275 | Tragic 43.4% |
| Sierra Leoneans | 0.1 /100 | #276 | Tragic 43.4% |
| Immigrants | Nigeria | 0.1 /100 | #277 | Tragic 43.4% |
| Central Americans | 0.0 /100 | #278 | Tragic 43.3% |
| Central American Indians | 0.0 /100 | #279 | Tragic 43.3% |