Jamaican vs Immigrants from Australia Currently Married
COMPARE
Jamaican
Immigrants from Australia
Currently Married
Currently Married Comparison
Jamaicans
Immigrants from Australia
41.4%
CURRENTLY MARRIED
0.0/ 100
METRIC RATING
313th/ 347
METRIC RANK
47.3%
CURRENTLY MARRIED
81.1/ 100
METRIC RATING
134th/ 347
METRIC RANK
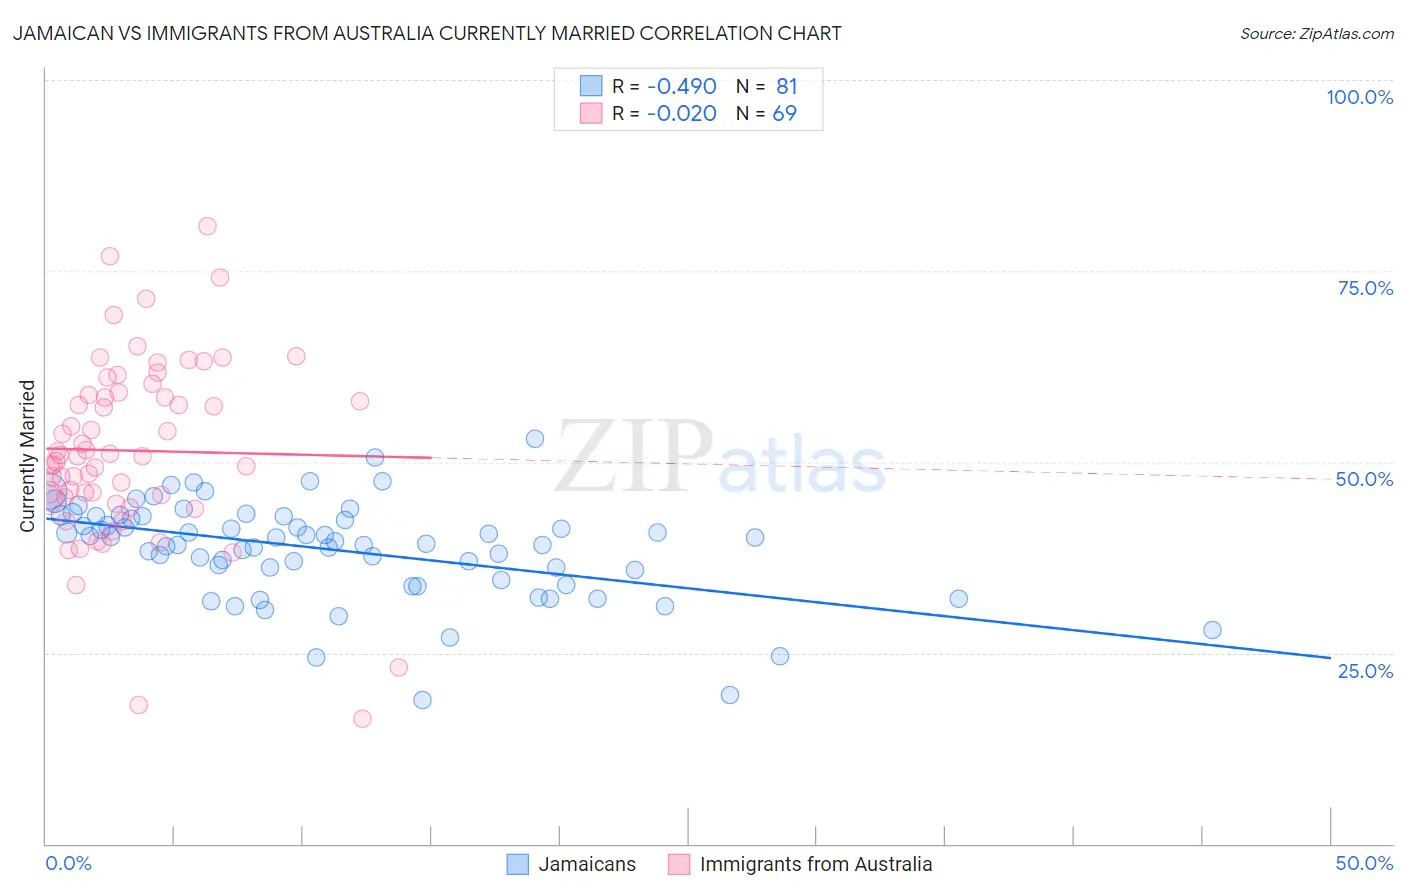
Jamaican vs Immigrants from Australia Currently Married Correlation Chart
The statistical analysis conducted on geographies consisting of 368,004,365 people shows a moderate negative correlation between the proportion of Jamaicans and percentage of population currently married in the United States with a correlation coefficient (R) of -0.490 and weighted average of 41.4%. Similarly, the statistical analysis conducted on geographies consisting of 227,193,510 people shows no correlation between the proportion of Immigrants from Australia and percentage of population currently married in the United States with a correlation coefficient (R) of -0.020 and weighted average of 47.3%, a difference of 14.3%.
Currently Married Correlation Summary
| Measurement | Jamaican | Immigrants from Australia |
| Minimum | 18.8% | 16.4% |
| Maximum | 53.1% | 80.8% |
| Range | 34.3% | 64.4% |
| Mean | 38.5% | 51.5% |
| Median | 39.6% | 50.7% |
| Interquartile 25% (IQ1) | 35.2% | 45.2% |
| Interquartile 75% (IQ3) | 42.9% | 58.9% |
| Interquartile Range (IQR) | 7.6% | 13.7% |
| Standard Deviation (Sample) | 6.4% | 12.0% |
| Standard Deviation (Population) | 6.4% | 11.9% |
Similar Demographics by Currently Married
Demographics Similar to Jamaicans by Currently Married
In terms of currently married, the demographic groups most similar to Jamaicans are West Indian (41.3%, a difference of 0.080%), Inupiat (41.3%, a difference of 0.16%), Immigrants from Caribbean (41.3%, a difference of 0.22%), Haitian (41.3%, a difference of 0.24%), and Somali (41.5%, a difference of 0.29%).
| Demographics | Rating | Rank | Currently Married |
| Immigrants | Guyana | 0.0 /100 | #306 | Tragic 41.9% |
| Africans | 0.0 /100 | #307 | Tragic 41.8% |
| Immigrants | Belize | 0.0 /100 | #308 | Tragic 41.8% |
| Immigrants | Liberia | 0.0 /100 | #309 | Tragic 41.8% |
| Guyanese | 0.0 /100 | #310 | Tragic 41.6% |
| Trinidadians and Tobagonians | 0.0 /100 | #311 | Tragic 41.5% |
| Somalis | 0.0 /100 | #312 | Tragic 41.5% |
| Jamaicans | 0.0 /100 | #313 | Tragic 41.4% |
| West Indians | 0.0 /100 | #314 | Tragic 41.3% |
| Inupiat | 0.0 /100 | #315 | Tragic 41.3% |
| Immigrants | Caribbean | 0.0 /100 | #316 | Tragic 41.3% |
| Haitians | 0.0 /100 | #317 | Tragic 41.3% |
| Bahamians | 0.0 /100 | #318 | Tragic 41.2% |
| Immigrants | Somalia | 0.0 /100 | #319 | Tragic 41.2% |
| Immigrants | Jamaica | 0.0 /100 | #320 | Tragic 41.1% |
Demographics Similar to Immigrants from Australia by Currently Married
In terms of currently married, the demographic groups most similar to Immigrants from Australia are Immigrants from Malaysia (47.3%, a difference of 0.0%), Afghan (47.3%, a difference of 0.050%), Icelander (47.3%, a difference of 0.080%), Immigrants from Norway (47.2%, a difference of 0.080%), and Immigrants from Iraq (47.3%, a difference of 0.11%).
| Demographics | Rating | Rank | Currently Married |
| New Zealanders | 84.9 /100 | #127 | Excellent 47.4% |
| Portuguese | 84.2 /100 | #128 | Excellent 47.3% |
| Sri Lankans | 83.2 /100 | #129 | Excellent 47.3% |
| Immigrants | Iraq | 82.8 /100 | #130 | Excellent 47.3% |
| Icelanders | 82.4 /100 | #131 | Excellent 47.3% |
| Afghans | 81.8 /100 | #132 | Excellent 47.3% |
| Immigrants | Malaysia | 81.1 /100 | #133 | Excellent 47.3% |
| Immigrants | Australia | 81.1 /100 | #134 | Excellent 47.3% |
| Immigrants | Norway | 79.7 /100 | #135 | Good 47.2% |
| Immigrants | Vietnam | 78.2 /100 | #136 | Good 47.2% |
| Paraguayans | 77.8 /100 | #137 | Good 47.2% |
| Pakistanis | 77.5 /100 | #138 | Good 47.2% |
| Yugoslavians | 77.4 /100 | #139 | Good 47.2% |
| Cajuns | 75.3 /100 | #140 | Good 47.1% |
| Venezuelans | 74.4 /100 | #141 | Good 47.1% |