Jamaican vs Immigrants from Armenia Currently Married
COMPARE
Jamaican
Immigrants from Armenia
Currently Married
Currently Married Comparison
Jamaicans
Immigrants from Armenia
41.4%
CURRENTLY MARRIED
0.0/ 100
METRIC RATING
313th/ 347
METRIC RANK
44.3%
CURRENTLY MARRIED
0.4/ 100
METRIC RATING
245th/ 347
METRIC RANK
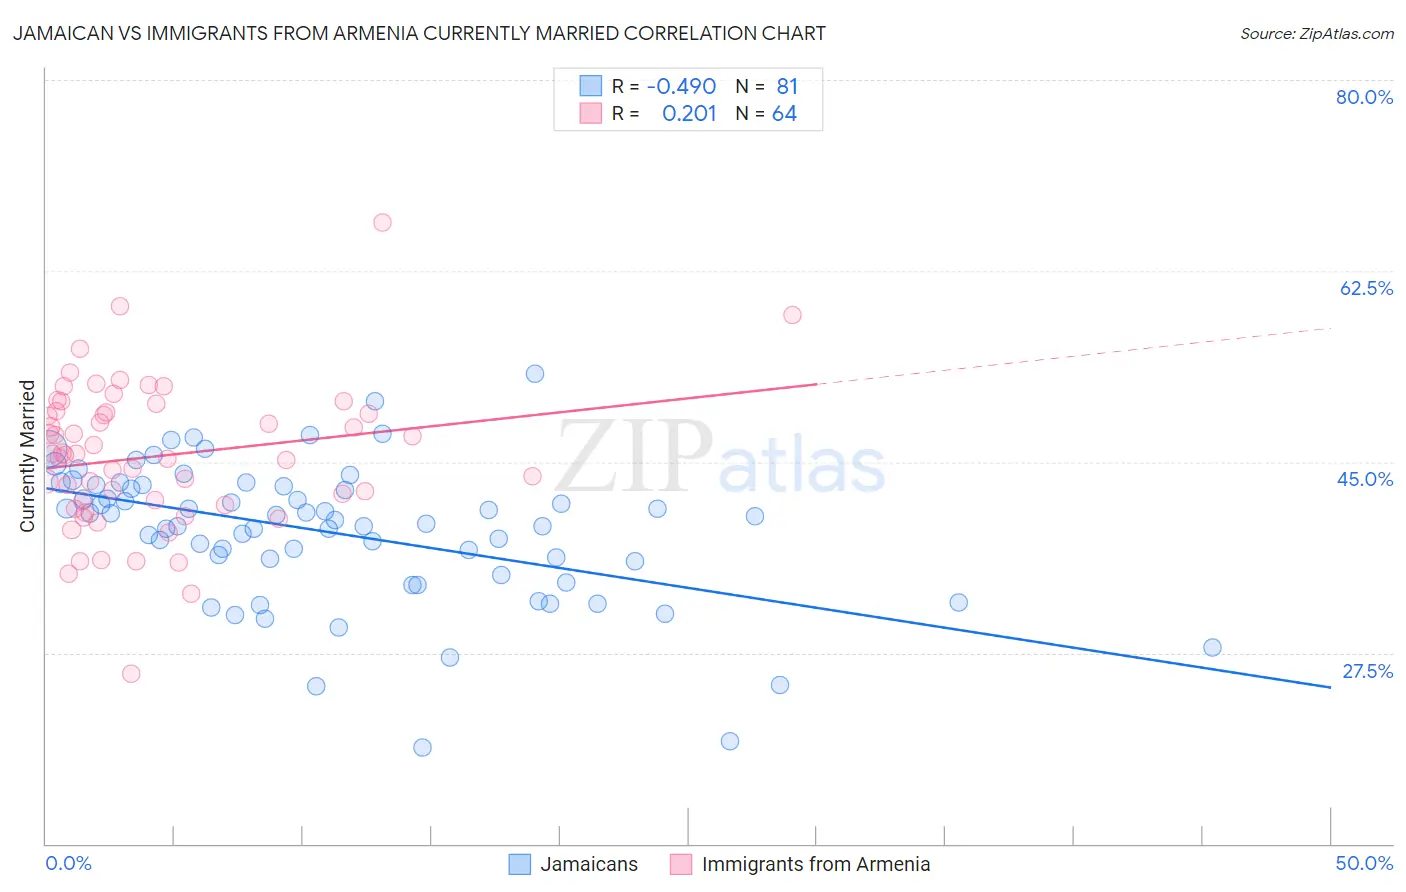
Jamaican vs Immigrants from Armenia Currently Married Correlation Chart
The statistical analysis conducted on geographies consisting of 368,004,365 people shows a moderate negative correlation between the proportion of Jamaicans and percentage of population currently married in the United States with a correlation coefficient (R) of -0.490 and weighted average of 41.4%. Similarly, the statistical analysis conducted on geographies consisting of 97,725,276 people shows a weak positive correlation between the proportion of Immigrants from Armenia and percentage of population currently married in the United States with a correlation coefficient (R) of 0.201 and weighted average of 44.3%, a difference of 7.2%.
Currently Married Correlation Summary
| Measurement | Jamaican | Immigrants from Armenia |
| Minimum | 18.8% | 25.6% |
| Maximum | 53.1% | 66.9% |
| Range | 34.3% | 41.3% |
| Mean | 38.5% | 45.5% |
| Median | 39.6% | 45.7% |
| Interquartile 25% (IQ1) | 35.2% | 41.2% |
| Interquartile 75% (IQ3) | 42.9% | 49.6% |
| Interquartile Range (IQR) | 7.6% | 8.3% |
| Standard Deviation (Sample) | 6.4% | 6.8% |
| Standard Deviation (Population) | 6.4% | 6.7% |
Similar Demographics by Currently Married
Demographics Similar to Jamaicans by Currently Married
In terms of currently married, the demographic groups most similar to Jamaicans are West Indian (41.3%, a difference of 0.080%), Inupiat (41.3%, a difference of 0.16%), Immigrants from Caribbean (41.3%, a difference of 0.22%), Haitian (41.3%, a difference of 0.24%), and Somali (41.5%, a difference of 0.29%).
| Demographics | Rating | Rank | Currently Married |
| Immigrants | Guyana | 0.0 /100 | #306 | Tragic 41.9% |
| Africans | 0.0 /100 | #307 | Tragic 41.8% |
| Immigrants | Belize | 0.0 /100 | #308 | Tragic 41.8% |
| Immigrants | Liberia | 0.0 /100 | #309 | Tragic 41.8% |
| Guyanese | 0.0 /100 | #310 | Tragic 41.6% |
| Trinidadians and Tobagonians | 0.0 /100 | #311 | Tragic 41.5% |
| Somalis | 0.0 /100 | #312 | Tragic 41.5% |
| Jamaicans | 0.0 /100 | #313 | Tragic 41.4% |
| West Indians | 0.0 /100 | #314 | Tragic 41.3% |
| Inupiat | 0.0 /100 | #315 | Tragic 41.3% |
| Immigrants | Caribbean | 0.0 /100 | #316 | Tragic 41.3% |
| Haitians | 0.0 /100 | #317 | Tragic 41.3% |
| Bahamians | 0.0 /100 | #318 | Tragic 41.2% |
| Immigrants | Somalia | 0.0 /100 | #319 | Tragic 41.2% |
| Immigrants | Jamaica | 0.0 /100 | #320 | Tragic 41.1% |
Demographics Similar to Immigrants from Armenia by Currently Married
In terms of currently married, the demographic groups most similar to Immigrants from Armenia are Immigrants from Burma/Myanmar (44.3%, a difference of 0.070%), Ugandan (44.2%, a difference of 0.20%), Nicaraguan (44.2%, a difference of 0.29%), Immigrants from Cameroon (44.2%, a difference of 0.30%), and Japanese (44.5%, a difference of 0.31%).
| Demographics | Rating | Rank | Currently Married |
| Moroccans | 0.9 /100 | #238 | Tragic 44.6% |
| Immigrants | Mexico | 0.7 /100 | #239 | Tragic 44.5% |
| Mexican American Indians | 0.7 /100 | #240 | Tragic 44.5% |
| Ethiopians | 0.7 /100 | #241 | Tragic 44.5% |
| Immigrants | Cambodia | 0.7 /100 | #242 | Tragic 44.5% |
| Immigrants | Ethiopia | 0.7 /100 | #243 | Tragic 44.5% |
| Japanese | 0.6 /100 | #244 | Tragic 44.5% |
| Immigrants | Armenia | 0.4 /100 | #245 | Tragic 44.3% |
| Immigrants | Burma/Myanmar | 0.4 /100 | #246 | Tragic 44.3% |
| Ugandans | 0.4 /100 | #247 | Tragic 44.2% |
| Nicaraguans | 0.3 /100 | #248 | Tragic 44.2% |
| Immigrants | Cameroon | 0.3 /100 | #249 | Tragic 44.2% |
| Immigrants | Eastern Africa | 0.3 /100 | #250 | Tragic 44.2% |
| Blackfeet | 0.3 /100 | #251 | Tragic 44.2% |
| Hispanics or Latinos | 0.3 /100 | #252 | Tragic 44.1% |