Jamaican vs Danish Currently Married
COMPARE
Jamaican
Danish
Currently Married
Currently Married Comparison
Jamaicans
Danes
41.4%
CURRENTLY MARRIED
0.0/ 100
METRIC RATING
313th/ 347
METRIC RANK
50.5%
CURRENTLY MARRIED
100.0/ 100
METRIC RATING
5th/ 347
METRIC RANK
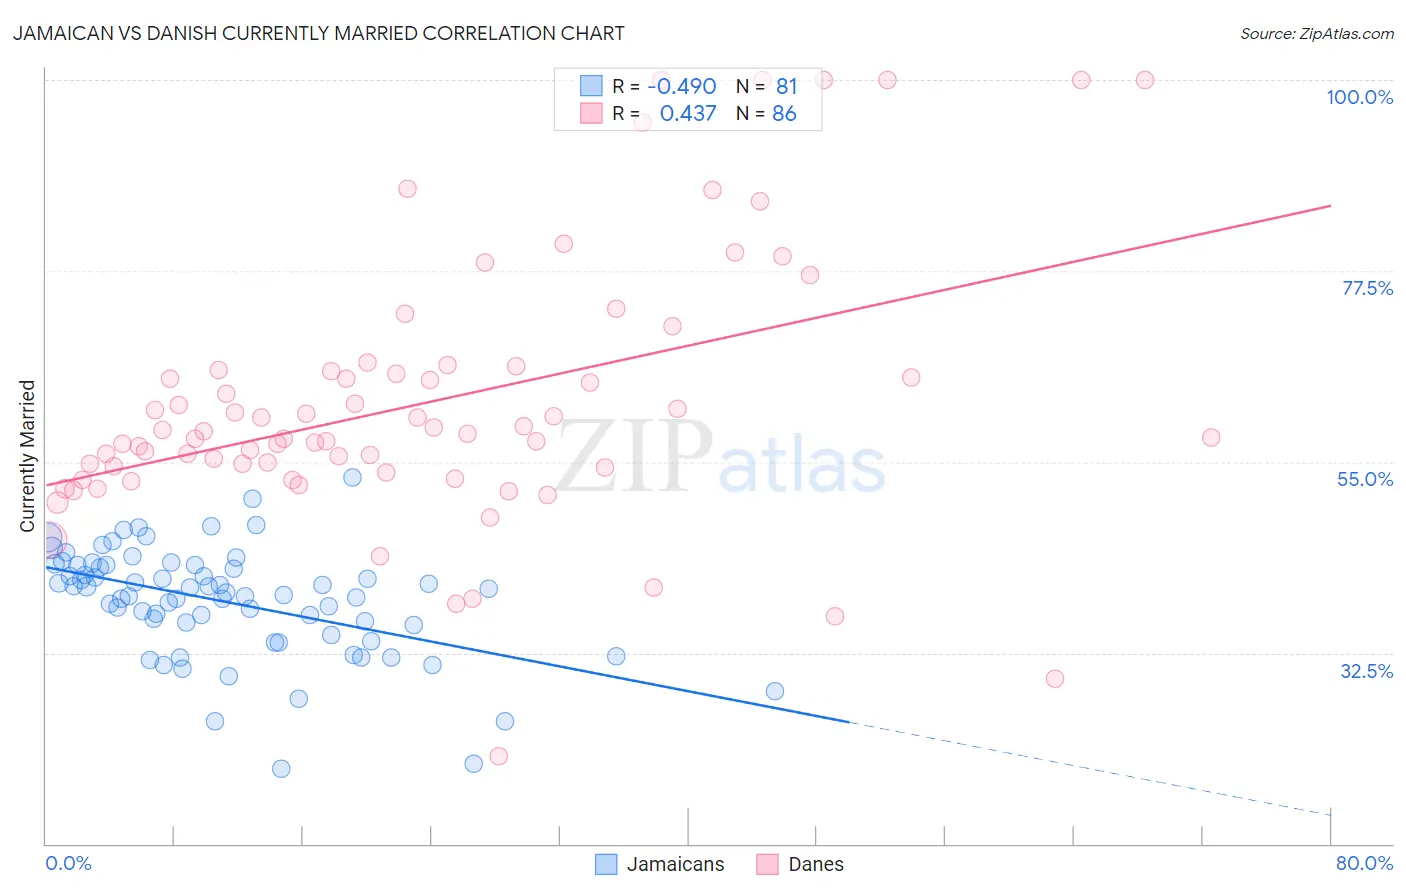
Jamaican vs Danish Currently Married Correlation Chart
The statistical analysis conducted on geographies consisting of 368,004,365 people shows a moderate negative correlation between the proportion of Jamaicans and percentage of population currently married in the United States with a correlation coefficient (R) of -0.490 and weighted average of 41.4%. Similarly, the statistical analysis conducted on geographies consisting of 474,135,576 people shows a moderate positive correlation between the proportion of Danes and percentage of population currently married in the United States with a correlation coefficient (R) of 0.437 and weighted average of 50.5%, a difference of 22.0%.
Currently Married Correlation Summary
| Measurement | Jamaican | Danish |
| Minimum | 18.8% | 20.3% |
| Maximum | 53.1% | 100.0% |
| Range | 34.3% | 79.7% |
| Mean | 38.5% | 62.1% |
| Median | 39.6% | 58.5% |
| Interquartile 25% (IQ1) | 35.2% | 54.3% |
| Interquartile 75% (IQ3) | 42.9% | 65.8% |
| Interquartile Range (IQR) | 7.6% | 11.5% |
| Standard Deviation (Sample) | 6.4% | 15.8% |
| Standard Deviation (Population) | 6.4% | 15.7% |
Similar Demographics by Currently Married
Demographics Similar to Jamaicans by Currently Married
In terms of currently married, the demographic groups most similar to Jamaicans are West Indian (41.3%, a difference of 0.080%), Inupiat (41.3%, a difference of 0.16%), Immigrants from Caribbean (41.3%, a difference of 0.22%), Haitian (41.3%, a difference of 0.24%), and Somali (41.5%, a difference of 0.29%).
| Demographics | Rating | Rank | Currently Married |
| Immigrants | Guyana | 0.0 /100 | #306 | Tragic 41.9% |
| Africans | 0.0 /100 | #307 | Tragic 41.8% |
| Immigrants | Belize | 0.0 /100 | #308 | Tragic 41.8% |
| Immigrants | Liberia | 0.0 /100 | #309 | Tragic 41.8% |
| Guyanese | 0.0 /100 | #310 | Tragic 41.6% |
| Trinidadians and Tobagonians | 0.0 /100 | #311 | Tragic 41.5% |
| Somalis | 0.0 /100 | #312 | Tragic 41.5% |
| Jamaicans | 0.0 /100 | #313 | Tragic 41.4% |
| West Indians | 0.0 /100 | #314 | Tragic 41.3% |
| Inupiat | 0.0 /100 | #315 | Tragic 41.3% |
| Immigrants | Caribbean | 0.0 /100 | #316 | Tragic 41.3% |
| Haitians | 0.0 /100 | #317 | Tragic 41.3% |
| Bahamians | 0.0 /100 | #318 | Tragic 41.2% |
| Immigrants | Somalia | 0.0 /100 | #319 | Tragic 41.2% |
| Immigrants | Jamaica | 0.0 /100 | #320 | Tragic 41.1% |
Demographics Similar to Danes by Currently Married
In terms of currently married, the demographic groups most similar to Danes are Norwegian (50.2%, a difference of 0.54%), Immigrants from Taiwan (50.7%, a difference of 0.55%), Assyrian/Chaldean/Syriac (50.8%, a difference of 0.63%), Thai (50.9%, a difference of 0.81%), and Immigrants from South Central Asia (50.0%, a difference of 0.88%).
| Demographics | Rating | Rank | Currently Married |
| Immigrants | India | 100.0 /100 | #1 | Exceptional 51.8% |
| Thais | 100.0 /100 | #2 | Exceptional 50.9% |
| Assyrians/Chaldeans/Syriacs | 100.0 /100 | #3 | Exceptional 50.8% |
| Immigrants | Taiwan | 100.0 /100 | #4 | Exceptional 50.7% |
| Danes | 100.0 /100 | #5 | Exceptional 50.5% |
| Norwegians | 100.0 /100 | #6 | Exceptional 50.2% |
| Immigrants | South Central Asia | 100.0 /100 | #7 | Exceptional 50.0% |
| Swedes | 100.0 /100 | #8 | Exceptional 50.0% |
| Czechs | 99.9 /100 | #9 | Exceptional 49.9% |
| Filipinos | 99.9 /100 | #10 | Exceptional 49.7% |
| English | 99.9 /100 | #11 | Exceptional 49.7% |
| Swiss | 99.9 /100 | #12 | Exceptional 49.7% |
| Dutch | 99.9 /100 | #13 | Exceptional 49.6% |
| Germans | 99.9 /100 | #14 | Exceptional 49.6% |
| Pennsylvania Germans | 99.9 /100 | #15 | Exceptional 49.6% |