Kiowa vs Palestinian Divorced or Separated
COMPARE
Kiowa
Palestinian
Divorced or Separated
Divorced or Separated Comparison
Kiowa
Palestinians
14.5%
DIVORCED OR SEPARATED
0.0/ 100
METRIC RATING
345th/ 347
METRIC RANK
11.5%
DIVORCED OR SEPARATED
99.7/ 100
METRIC RATING
68th/ 347
METRIC RANK
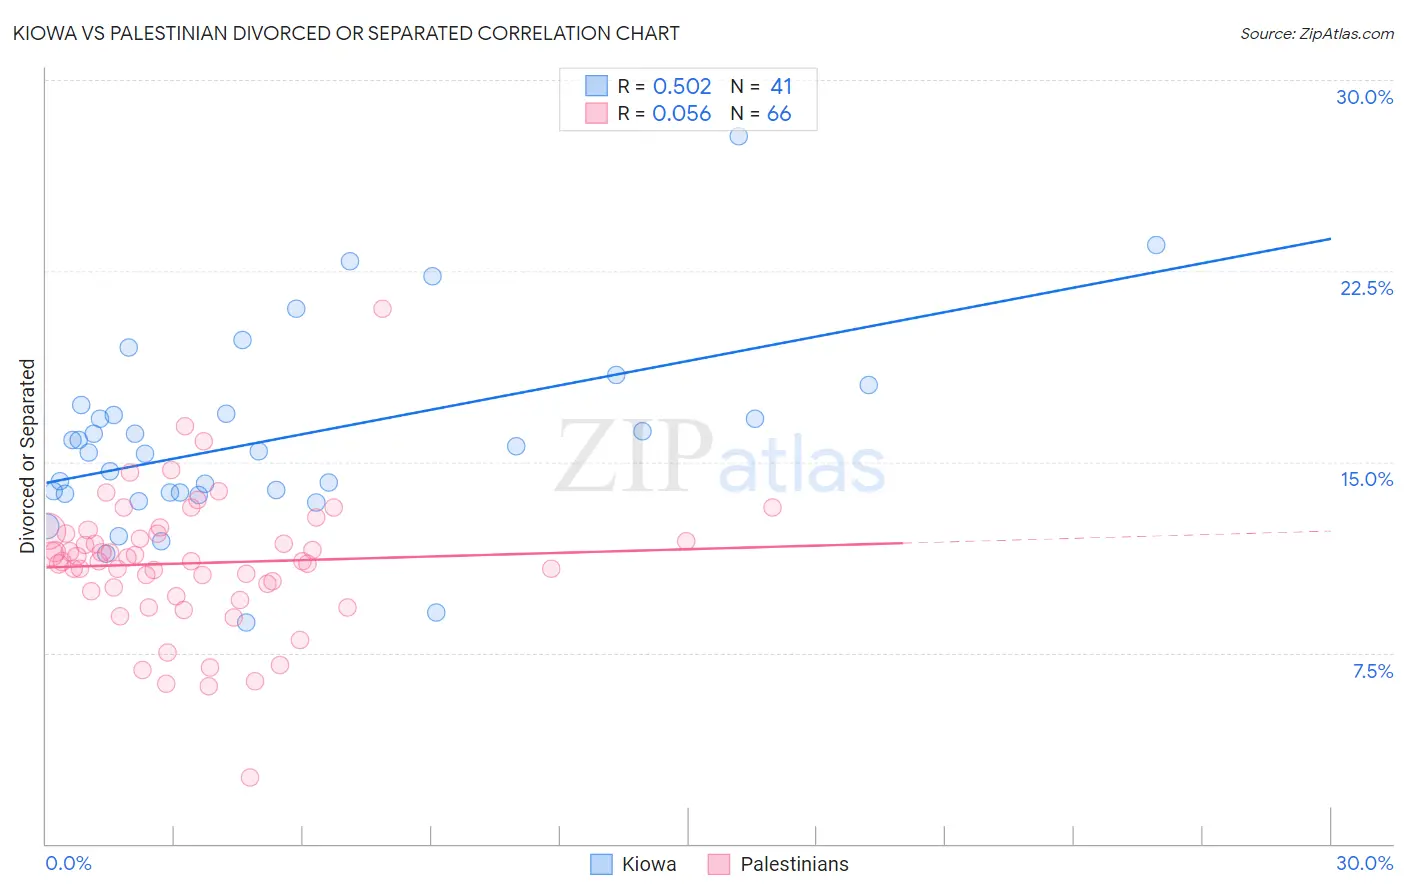
Kiowa vs Palestinian Divorced or Separated Correlation Chart
The statistical analysis conducted on geographies consisting of 56,101,840 people shows a substantial positive correlation between the proportion of Kiowa and percentage of population currently divorced or separated in the United States with a correlation coefficient (R) of 0.502 and weighted average of 14.5%. Similarly, the statistical analysis conducted on geographies consisting of 216,394,525 people shows a slight positive correlation between the proportion of Palestinians and percentage of population currently divorced or separated in the United States with a correlation coefficient (R) of 0.056 and weighted average of 11.5%, a difference of 26.8%.
Divorced or Separated Correlation Summary
| Measurement | Kiowa | Palestinian |
| Minimum | 8.7% | 2.6% |
| Maximum | 27.8% | 21.0% |
| Range | 19.1% | 18.4% |
| Mean | 15.9% | 11.0% |
| Median | 15.4% | 11.1% |
| Interquartile 25% (IQ1) | 13.8% | 9.9% |
| Interquartile 75% (IQ3) | 17.1% | 12.2% |
| Interquartile Range (IQR) | 3.3% | 2.3% |
| Standard Deviation (Sample) | 3.8% | 2.7% |
| Standard Deviation (Population) | 3.7% | 2.7% |
Similar Demographics by Divorced or Separated
Demographics Similar to Kiowa by Divorced or Separated
In terms of divorced or separated, the demographic groups most similar to Kiowa are Cuban (14.5%, a difference of 0.10%), Creek (14.4%, a difference of 0.77%), Seminole (14.3%, a difference of 1.8%), Bahamian (14.2%, a difference of 2.0%), and Arapaho (14.8%, a difference of 2.1%).
| Demographics | Rating | Rank | Divorced or Separated |
| Puerto Ricans | 0.0 /100 | #333 | Tragic 13.9% |
| Immigrants | Bahamas | 0.0 /100 | #334 | Tragic 13.9% |
| Dutch West Indians | 0.0 /100 | #335 | Tragic 14.0% |
| Shoshone | 0.0 /100 | #336 | Tragic 14.0% |
| Crow | 0.0 /100 | #337 | Tragic 14.1% |
| Choctaw | 0.0 /100 | #338 | Tragic 14.1% |
| Colville | 0.0 /100 | #339 | Tragic 14.2% |
| Chickasaw | 0.0 /100 | #340 | Tragic 14.2% |
| Bahamians | 0.0 /100 | #341 | Tragic 14.2% |
| Seminole | 0.0 /100 | #342 | Tragic 14.3% |
| Creek | 0.0 /100 | #343 | Tragic 14.4% |
| Cubans | 0.0 /100 | #344 | Tragic 14.5% |
| Kiowa | 0.0 /100 | #345 | Tragic 14.5% |
| Arapaho | 0.0 /100 | #346 | Tragic 14.8% |
| Immigrants | Cuba | 0.0 /100 | #347 | Tragic 15.2% |
Demographics Similar to Palestinians by Divorced or Separated
In terms of divorced or separated, the demographic groups most similar to Palestinians are Immigrants from Belgium (11.5%, a difference of 0.0%), Immigrants from Eastern Europe (11.5%, a difference of 0.020%), Immigrants from Syria (11.4%, a difference of 0.11%), Paraguayan (11.5%, a difference of 0.12%), and Jordanian (11.5%, a difference of 0.18%).
| Demographics | Rating | Rank | Divorced or Separated |
| Koreans | 99.9 /100 | #61 | Exceptional 11.3% |
| Luxembourgers | 99.9 /100 | #62 | Exceptional 11.3% |
| Immigrants | Kuwait | 99.9 /100 | #63 | Exceptional 11.3% |
| Macedonians | 99.8 /100 | #64 | Exceptional 11.4% |
| Immigrants | South Eastern Asia | 99.8 /100 | #65 | Exceptional 11.4% |
| Inupiat | 99.8 /100 | #66 | Exceptional 11.4% |
| Immigrants | Syria | 99.7 /100 | #67 | Exceptional 11.4% |
| Palestinians | 99.7 /100 | #68 | Exceptional 11.5% |
| Immigrants | Belgium | 99.7 /100 | #69 | Exceptional 11.5% |
| Immigrants | Eastern Europe | 99.7 /100 | #70 | Exceptional 11.5% |
| Paraguayans | 99.7 /100 | #71 | Exceptional 11.5% |
| Jordanians | 99.6 /100 | #72 | Exceptional 11.5% |
| Immigrants | North Macedonia | 99.6 /100 | #73 | Exceptional 11.5% |
| Taiwanese | 99.6 /100 | #74 | Exceptional 11.5% |
| Immigrants | Northern Africa | 99.6 /100 | #75 | Exceptional 11.5% |