Dominican vs Palestinian Divorced or Separated
COMPARE
Dominican
Palestinian
Divorced or Separated
Divorced or Separated Comparison
Dominicans
Palestinians
12.7%
DIVORCED OR SEPARATED
0.2/ 100
METRIC RATING
277th/ 347
METRIC RANK
11.5%
DIVORCED OR SEPARATED
99.7/ 100
METRIC RATING
68th/ 347
METRIC RANK
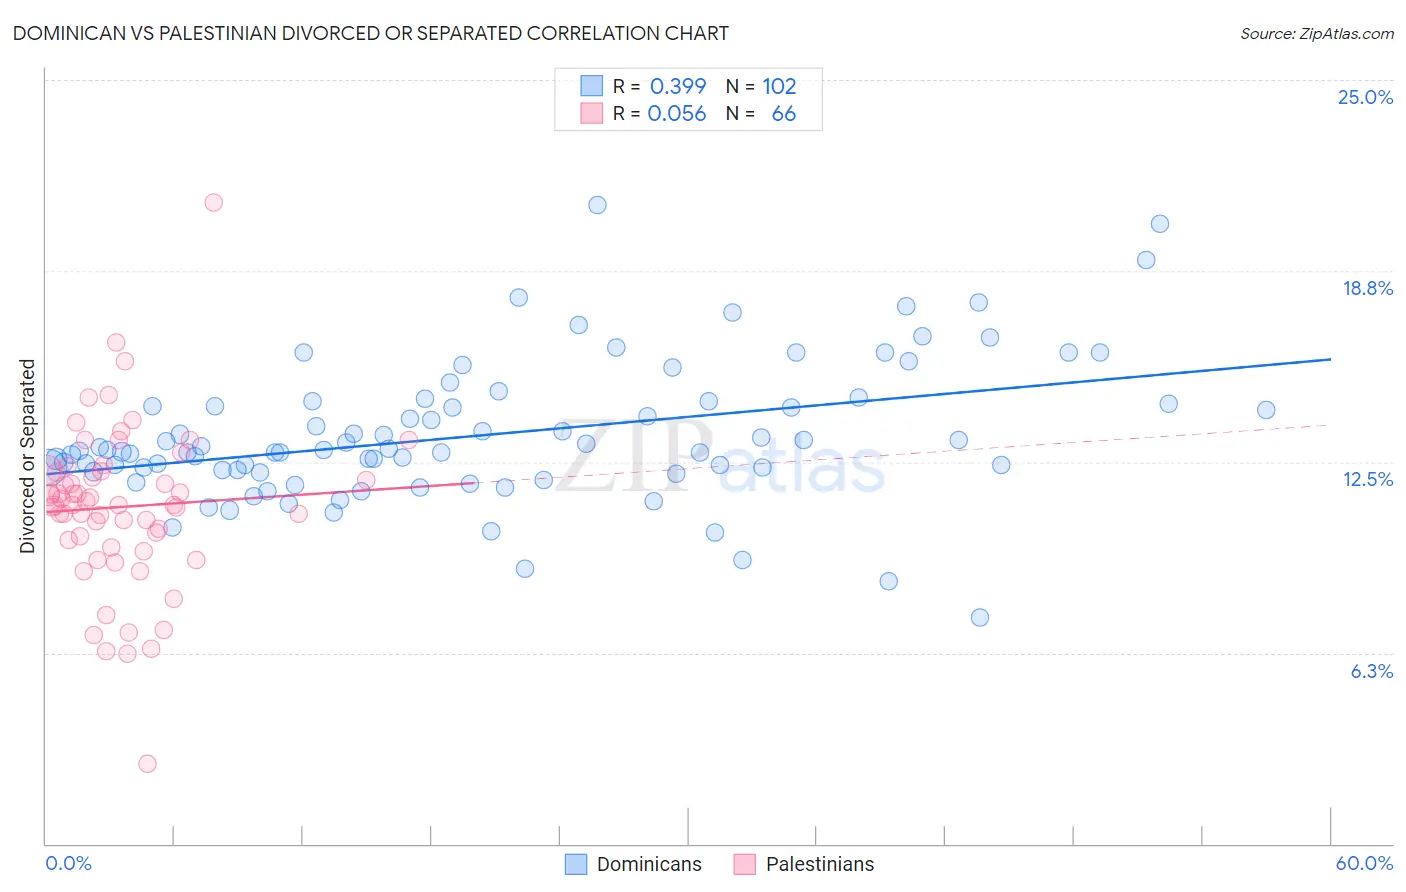
Dominican vs Palestinian Divorced or Separated Correlation Chart
The statistical analysis conducted on geographies consisting of 354,903,944 people shows a mild positive correlation between the proportion of Dominicans and percentage of population currently divorced or separated in the United States with a correlation coefficient (R) of 0.399 and weighted average of 12.7%. Similarly, the statistical analysis conducted on geographies consisting of 216,394,525 people shows a slight positive correlation between the proportion of Palestinians and percentage of population currently divorced or separated in the United States with a correlation coefficient (R) of 0.056 and weighted average of 11.5%, a difference of 10.8%.
Divorced or Separated Correlation Summary
| Measurement | Dominican | Palestinian |
| Minimum | 7.4% | 2.6% |
| Maximum | 20.9% | 21.0% |
| Range | 13.5% | 18.4% |
| Mean | 13.4% | 11.0% |
| Median | 12.9% | 11.1% |
| Interquartile 25% (IQ1) | 12.2% | 9.9% |
| Interquartile 75% (IQ3) | 14.4% | 12.2% |
| Interquartile Range (IQR) | 2.2% | 2.3% |
| Standard Deviation (Sample) | 2.3% | 2.7% |
| Standard Deviation (Population) | 2.3% | 2.7% |
Similar Demographics by Divorced or Separated
Demographics Similar to Dominicans by Divorced or Separated
In terms of divorced or separated, the demographic groups most similar to Dominicans are Spaniard (12.7%, a difference of 0.050%), Central American Indian (12.7%, a difference of 0.11%), Bermudan (12.7%, a difference of 0.14%), Immigrants from Micronesia (12.7%, a difference of 0.15%), and Lumbee (12.7%, a difference of 0.16%).
| Demographics | Rating | Rank | Divorced or Separated |
| Ute | 0.4 /100 | #270 | Tragic 12.6% |
| Panamanians | 0.3 /100 | #271 | Tragic 12.7% |
| Immigrants | Middle Africa | 0.3 /100 | #272 | Tragic 12.7% |
| Immigrants | Micronesia | 0.3 /100 | #273 | Tragic 12.7% |
| Bermudans | 0.3 /100 | #274 | Tragic 12.7% |
| Central American Indians | 0.3 /100 | #275 | Tragic 12.7% |
| Spaniards | 0.2 /100 | #276 | Tragic 12.7% |
| Dominicans | 0.2 /100 | #277 | Tragic 12.7% |
| Lumbee | 0.2 /100 | #278 | Tragic 12.7% |
| Immigrants | Dominican Republic | 0.2 /100 | #279 | Tragic 12.7% |
| Immigrants | Zaire | 0.2 /100 | #280 | Tragic 12.7% |
| Pueblo | 0.2 /100 | #281 | Tragic 12.7% |
| Sub-Saharan Africans | 0.1 /100 | #282 | Tragic 12.7% |
| Delaware | 0.1 /100 | #283 | Tragic 12.7% |
| Immigrants | Nonimmigrants | 0.1 /100 | #284 | Tragic 12.8% |
Demographics Similar to Palestinians by Divorced or Separated
In terms of divorced or separated, the demographic groups most similar to Palestinians are Immigrants from Belgium (11.5%, a difference of 0.0%), Immigrants from Eastern Europe (11.5%, a difference of 0.020%), Immigrants from Syria (11.4%, a difference of 0.11%), Paraguayan (11.5%, a difference of 0.12%), and Jordanian (11.5%, a difference of 0.18%).
| Demographics | Rating | Rank | Divorced or Separated |
| Koreans | 99.9 /100 | #61 | Exceptional 11.3% |
| Luxembourgers | 99.9 /100 | #62 | Exceptional 11.3% |
| Immigrants | Kuwait | 99.9 /100 | #63 | Exceptional 11.3% |
| Macedonians | 99.8 /100 | #64 | Exceptional 11.4% |
| Immigrants | South Eastern Asia | 99.8 /100 | #65 | Exceptional 11.4% |
| Inupiat | 99.8 /100 | #66 | Exceptional 11.4% |
| Immigrants | Syria | 99.7 /100 | #67 | Exceptional 11.4% |
| Palestinians | 99.7 /100 | #68 | Exceptional 11.5% |
| Immigrants | Belgium | 99.7 /100 | #69 | Exceptional 11.5% |
| Immigrants | Eastern Europe | 99.7 /100 | #70 | Exceptional 11.5% |
| Paraguayans | 99.7 /100 | #71 | Exceptional 11.5% |
| Jordanians | 99.6 /100 | #72 | Exceptional 11.5% |
| Immigrants | North Macedonia | 99.6 /100 | #73 | Exceptional 11.5% |
| Taiwanese | 99.6 /100 | #74 | Exceptional 11.5% |
| Immigrants | Northern Africa | 99.6 /100 | #75 | Exceptional 11.5% |