Iroquois vs Palestinian 11th Grade
COMPARE
Iroquois
Palestinian
11th Grade
11th Grade Comparison
Iroquois
Palestinians
92.8%
11TH GRADE
79.1/ 100
METRIC RATING
146th/ 347
METRIC RANK
93.4%
11TH GRADE
97.7/ 100
METRIC RATING
115th/ 347
METRIC RANK
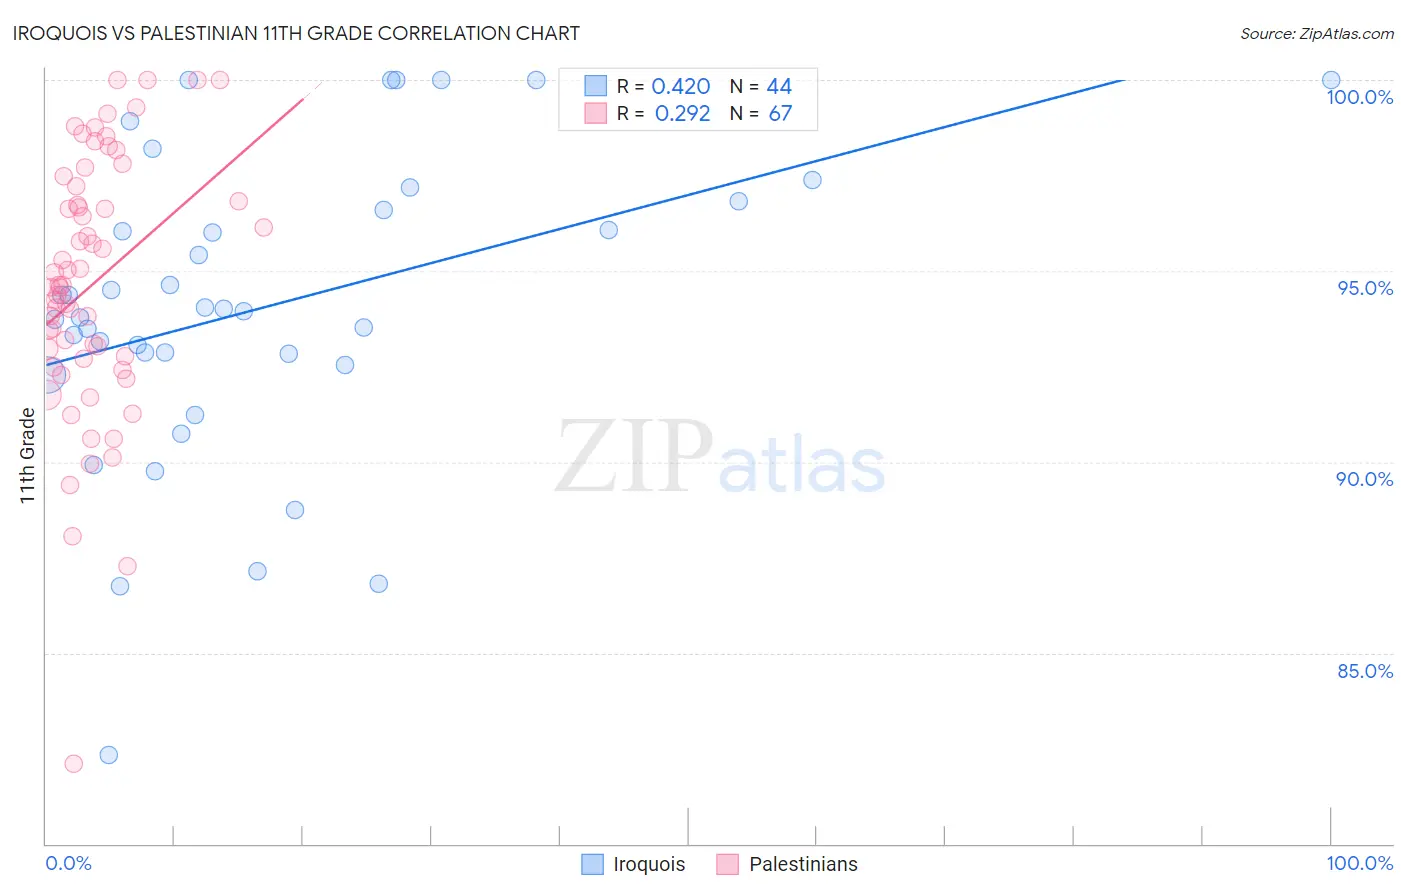
Iroquois vs Palestinian 11th Grade Correlation Chart
The statistical analysis conducted on geographies consisting of 207,308,653 people shows a moderate positive correlation between the proportion of Iroquois and percentage of population with at least 11th grade education in the United States with a correlation coefficient (R) of 0.420 and weighted average of 92.8%. Similarly, the statistical analysis conducted on geographies consisting of 216,461,770 people shows a weak positive correlation between the proportion of Palestinians and percentage of population with at least 11th grade education in the United States with a correlation coefficient (R) of 0.292 and weighted average of 93.4%, a difference of 0.59%.
11th Grade Correlation Summary
| Measurement | Iroquois | Palestinian |
| Minimum | 82.3% | 82.1% |
| Maximum | 100.0% | 100.0% |
| Range | 17.7% | 17.9% |
| Mean | 94.1% | 94.7% |
| Median | 94.0% | 94.6% |
| Interquartile 25% (IQ1) | 92.7% | 92.7% |
| Interquartile 75% (IQ3) | 96.7% | 97.2% |
| Interquartile Range (IQR) | 4.0% | 4.5% |
| Standard Deviation (Sample) | 4.0% | 3.4% |
| Standard Deviation (Population) | 4.0% | 3.4% |
Similar Demographics by 11th Grade
Demographics Similar to Iroquois by 11th Grade
In terms of 11th grade, the demographic groups most similar to Iroquois are Pakistani (92.8%, a difference of 0.010%), Immigrants from Kenya (92.8%, a difference of 0.010%), Hmong (92.8%, a difference of 0.010%), Immigrants from Poland (92.8%, a difference of 0.010%), and Assyrian/Chaldean/Syriac (92.8%, a difference of 0.020%).
| Demographics | Rating | Rank | 11th Grade |
| Crow | 84.1 /100 | #139 | Excellent 92.9% |
| Venezuelans | 83.4 /100 | #140 | Excellent 92.9% |
| Chileans | 83.0 /100 | #141 | Excellent 92.9% |
| Kenyans | 82.0 /100 | #142 | Excellent 92.9% |
| Ugandans | 81.4 /100 | #143 | Excellent 92.9% |
| Assyrians/Chaldeans/Syriacs | 80.5 /100 | #144 | Excellent 92.8% |
| Pakistanis | 79.6 /100 | #145 | Good 92.8% |
| Iroquois | 79.1 /100 | #146 | Good 92.8% |
| Immigrants | Kenya | 78.7 /100 | #147 | Good 92.8% |
| Hmong | 78.6 /100 | #148 | Good 92.8% |
| Immigrants | Poland | 78.5 /100 | #149 | Good 92.8% |
| Immigrants | Egypt | 77.5 /100 | #150 | Good 92.8% |
| Potawatomi | 74.3 /100 | #151 | Good 92.8% |
| Iraqis | 74.2 /100 | #152 | Good 92.8% |
| Brazilians | 73.9 /100 | #153 | Good 92.8% |
Demographics Similar to Palestinians by 11th Grade
In terms of 11th grade, the demographic groups most similar to Palestinians are Jordanian (93.4%, a difference of 0.010%), Immigrants from Zimbabwe (93.4%, a difference of 0.020%), Immigrants from Hungary (93.4%, a difference of 0.020%), White/Caucasian (93.3%, a difference of 0.030%), and Immigrants from Germany (93.4%, a difference of 0.040%).
| Demographics | Rating | Rank | 11th Grade |
| Alaska Natives | 98.4 /100 | #108 | Exceptional 93.5% |
| Immigrants | Kuwait | 98.4 /100 | #109 | Exceptional 93.5% |
| Syrians | 98.4 /100 | #110 | Exceptional 93.4% |
| Yugoslavians | 98.1 /100 | #111 | Exceptional 93.4% |
| Immigrants | Germany | 98.0 /100 | #112 | Exceptional 93.4% |
| Immigrants | Zimbabwe | 97.8 /100 | #113 | Exceptional 93.4% |
| Jordanians | 97.8 /100 | #114 | Exceptional 93.4% |
| Palestinians | 97.7 /100 | #115 | Exceptional 93.4% |
| Immigrants | Hungary | 97.5 /100 | #116 | Exceptional 93.4% |
| Whites/Caucasians | 97.4 /100 | #117 | Exceptional 93.3% |
| Immigrants | Korea | 97.0 /100 | #118 | Exceptional 93.3% |
| Israelis | 97.0 /100 | #119 | Exceptional 93.3% |
| Immigrants | Russia | 96.6 /100 | #120 | Exceptional 93.3% |
| German Russians | 96.4 /100 | #121 | Exceptional 93.3% |
| Immigrants | Belarus | 96.3 /100 | #122 | Exceptional 93.3% |