Chickasaw vs Immigrants from Netherlands Divorced or Separated
COMPARE
Chickasaw
Immigrants from Netherlands
Divorced or Separated
Divorced or Separated Comparison
Chickasaw
Immigrants from Netherlands
14.2%
DIVORCED OR SEPARATED
0.0/ 100
METRIC RATING
340th/ 347
METRIC RANK
11.9%
DIVORCED OR SEPARATED
83.9/ 100
METRIC RATING
138th/ 347
METRIC RANK
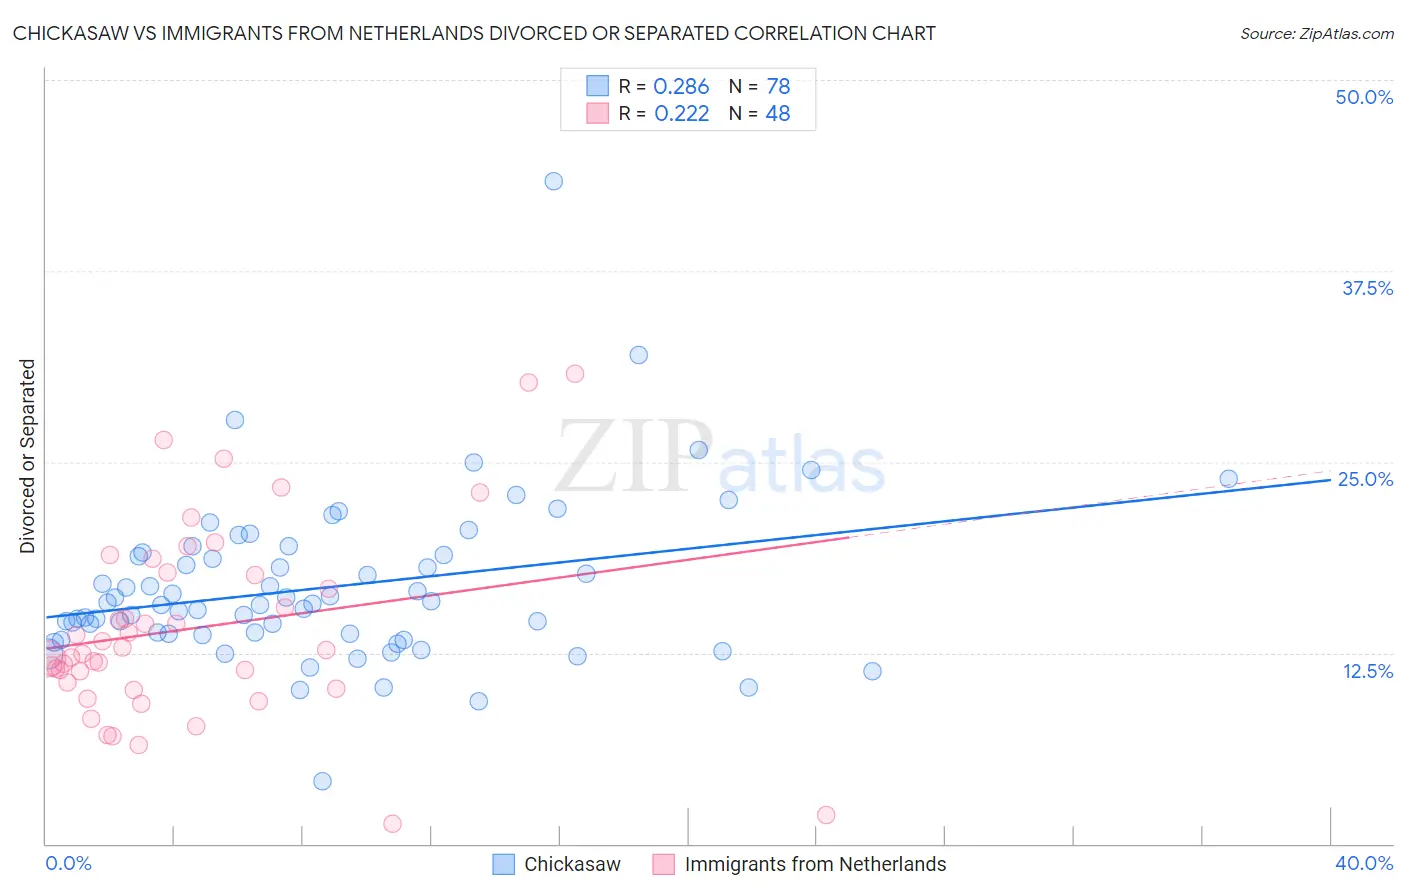
Chickasaw vs Immigrants from Netherlands Divorced or Separated Correlation Chart
The statistical analysis conducted on geographies consisting of 147,714,015 people shows a weak positive correlation between the proportion of Chickasaw and percentage of population currently divorced or separated in the United States with a correlation coefficient (R) of 0.286 and weighted average of 14.2%. Similarly, the statistical analysis conducted on geographies consisting of 237,821,691 people shows a weak positive correlation between the proportion of Immigrants from Netherlands and percentage of population currently divorced or separated in the United States with a correlation coefficient (R) of 0.222 and weighted average of 11.9%, a difference of 19.5%.
Divorced or Separated Correlation Summary
| Measurement | Chickasaw | Immigrants from Netherlands |
| Minimum | 4.1% | 1.3% |
| Maximum | 43.4% | 30.8% |
| Range | 39.3% | 29.5% |
| Mean | 16.8% | 14.1% |
| Median | 15.7% | 12.6% |
| Interquartile 25% (IQ1) | 13.8% | 10.4% |
| Interquartile 75% (IQ3) | 18.9% | 17.7% |
| Interquartile Range (IQR) | 5.1% | 7.3% |
| Standard Deviation (Sample) | 5.4% | 6.3% |
| Standard Deviation (Population) | 5.4% | 6.3% |
Similar Demographics by Divorced or Separated
Demographics Similar to Chickasaw by Divorced or Separated
In terms of divorced or separated, the demographic groups most similar to Chickasaw are Colville (14.2%, a difference of 0.040%), Bahamian (14.2%, a difference of 0.20%), Seminole (14.3%, a difference of 0.36%), Choctaw (14.1%, a difference of 0.57%), and Crow (14.1%, a difference of 0.88%).
| Demographics | Rating | Rank | Divorced or Separated |
| Puerto Ricans | 0.0 /100 | #333 | Tragic 13.9% |
| Immigrants | Bahamas | 0.0 /100 | #334 | Tragic 13.9% |
| Dutch West Indians | 0.0 /100 | #335 | Tragic 14.0% |
| Shoshone | 0.0 /100 | #336 | Tragic 14.0% |
| Crow | 0.0 /100 | #337 | Tragic 14.1% |
| Choctaw | 0.0 /100 | #338 | Tragic 14.1% |
| Colville | 0.0 /100 | #339 | Tragic 14.2% |
| Chickasaw | 0.0 /100 | #340 | Tragic 14.2% |
| Bahamians | 0.0 /100 | #341 | Tragic 14.2% |
| Seminole | 0.0 /100 | #342 | Tragic 14.3% |
| Creek | 0.0 /100 | #343 | Tragic 14.4% |
| Cubans | 0.0 /100 | #344 | Tragic 14.5% |
| Kiowa | 0.0 /100 | #345 | Tragic 14.5% |
| Arapaho | 0.0 /100 | #346 | Tragic 14.8% |
| Immigrants | Cuba | 0.0 /100 | #347 | Tragic 15.2% |
Demographics Similar to Immigrants from Netherlands by Divorced or Separated
In terms of divorced or separated, the demographic groups most similar to Immigrants from Netherlands are Alsatian (11.9%, a difference of 0.0%), Australian (11.9%, a difference of 0.020%), Lebanese (11.9%, a difference of 0.030%), Danish (11.9%, a difference of 0.060%), and Carpatho Rusyn (11.9%, a difference of 0.060%).
| Demographics | Rating | Rank | Divorced or Separated |
| Immigrants | Cambodia | 88.2 /100 | #131 | Excellent 11.8% |
| Immigrants | Afghanistan | 87.9 /100 | #132 | Excellent 11.8% |
| New Zealanders | 87.5 /100 | #133 | Excellent 11.9% |
| Argentineans | 85.1 /100 | #134 | Excellent 11.9% |
| Danes | 84.8 /100 | #135 | Excellent 11.9% |
| Carpatho Rusyns | 84.8 /100 | #136 | Excellent 11.9% |
| Alsatians | 84.0 /100 | #137 | Excellent 11.9% |
| Immigrants | Netherlands | 83.9 /100 | #138 | Excellent 11.9% |
| Australians | 83.6 /100 | #139 | Excellent 11.9% |
| Lebanese | 83.4 /100 | #140 | Excellent 11.9% |
| Immigrants | Morocco | 82.9 /100 | #141 | Excellent 11.9% |
| Immigrants | Zimbabwe | 81.5 /100 | #142 | Excellent 11.9% |
| Pakistanis | 81.3 /100 | #143 | Excellent 11.9% |
| Peruvians | 80.9 /100 | #144 | Excellent 11.9% |
| Croatians | 80.6 /100 | #145 | Excellent 11.9% |