Iroquois vs Immigrants from Netherlands Disability Age 35 to 64
COMPARE
Iroquois
Immigrants from Netherlands
Disability Age 35 to 64
Disability Age 35 to 64 Comparison
Iroquois
Immigrants from Netherlands
14.4%
DISABILITY AGE 35 TO 64
0.0/ 100
METRIC RATING
313th/ 347
METRIC RANK
10.5%
DISABILITY AGE 35 TO 64
96.3/ 100
METRIC RATING
115th/ 347
METRIC RANK
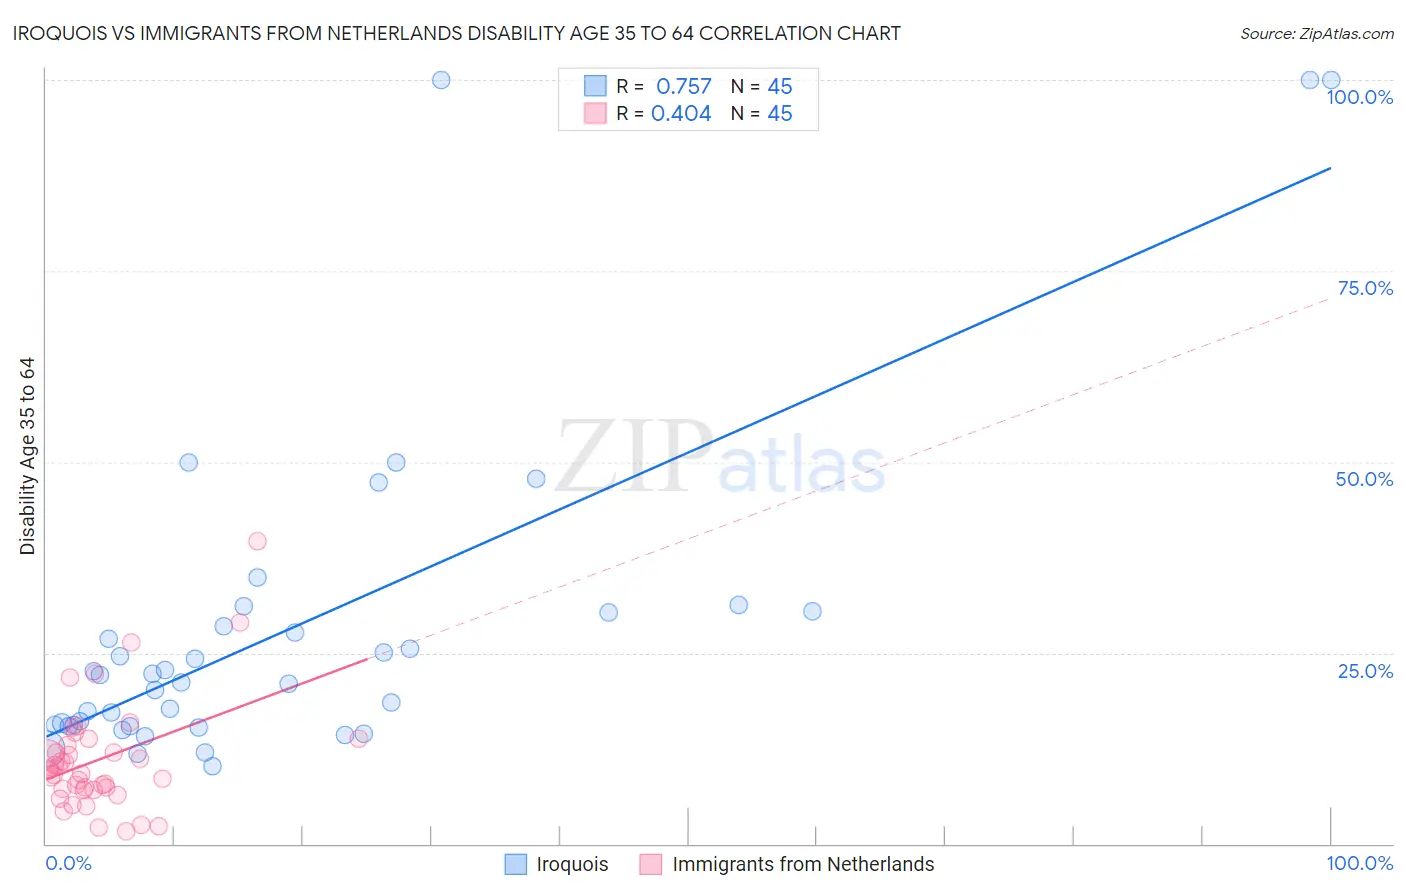
Iroquois vs Immigrants from Netherlands Disability Age 35 to 64 Correlation Chart
The statistical analysis conducted on geographies consisting of 207,235,793 people shows a strong positive correlation between the proportion of Iroquois and percentage of population with a disability between the ages 34 and 64 in the United States with a correlation coefficient (R) of 0.757 and weighted average of 14.4%. Similarly, the statistical analysis conducted on geographies consisting of 237,797,578 people shows a moderate positive correlation between the proportion of Immigrants from Netherlands and percentage of population with a disability between the ages 34 and 64 in the United States with a correlation coefficient (R) of 0.404 and weighted average of 10.5%, a difference of 36.2%.
Disability Age 35 to 64 Correlation Summary
| Measurement | Iroquois | Immigrants from Netherlands |
| Minimum | 10.2% | 1.7% |
| Maximum | 100.0% | 39.6% |
| Range | 89.8% | 37.9% |
| Mean | 28.2% | 11.1% |
| Median | 22.1% | 9.6% |
| Interquartile 25% (IQ1) | 15.5% | 7.1% |
| Interquartile 75% (IQ3) | 30.4% | 13.3% |
| Interquartile Range (IQR) | 14.9% | 6.2% |
| Standard Deviation (Sample) | 21.9% | 7.3% |
| Standard Deviation (Population) | 21.6% | 7.2% |
Similar Demographics by Disability Age 35 to 64
Demographics Similar to Iroquois by Disability Age 35 to 64
In terms of disability age 35 to 64, the demographic groups most similar to Iroquois are Paiute (14.3%, a difference of 0.44%), Immigrants from the Azores (14.3%, a difference of 0.58%), Shoshone (14.5%, a difference of 0.76%), Alaska Native (14.5%, a difference of 0.77%), and Osage (14.5%, a difference of 0.97%).
| Demographics | Rating | Rank | Disability Age 35 to 64 |
| Immigrants | Yemen | 0.0 /100 | #306 | Tragic 14.0% |
| Blackfeet | 0.0 /100 | #307 | Tragic 14.1% |
| Inupiat | 0.0 /100 | #308 | Tragic 14.1% |
| Cree | 0.0 /100 | #309 | Tragic 14.1% |
| Cape Verdeans | 0.0 /100 | #310 | Tragic 14.1% |
| Immigrants | Azores | 0.0 /100 | #311 | Tragic 14.3% |
| Paiute | 0.0 /100 | #312 | Tragic 14.3% |
| Iroquois | 0.0 /100 | #313 | Tragic 14.4% |
| Shoshone | 0.0 /100 | #314 | Tragic 14.5% |
| Alaska Natives | 0.0 /100 | #315 | Tragic 14.5% |
| Osage | 0.0 /100 | #316 | Tragic 14.5% |
| Crow | 0.0 /100 | #317 | Tragic 14.6% |
| Ottawa | 0.0 /100 | #318 | Tragic 14.6% |
| Immigrants | Cabo Verde | 0.0 /100 | #319 | Tragic 14.7% |
| Blacks/African Americans | 0.0 /100 | #320 | Tragic 14.7% |
Demographics Similar to Immigrants from Netherlands by Disability Age 35 to 64
In terms of disability age 35 to 64, the demographic groups most similar to Immigrants from Netherlands are Immigrants from Morocco (10.5%, a difference of 0.17%), Tongan (10.5%, a difference of 0.21%), Immigrants from Nepal (10.6%, a difference of 0.23%), Immigrants from South Eastern Asia (10.6%, a difference of 0.33%), and Assyrian/Chaldean/Syriac (10.5%, a difference of 0.34%).
| Demographics | Rating | Rank | Disability Age 35 to 64 |
| Ethiopians | 97.4 /100 | #108 | Exceptional 10.5% |
| Immigrants | Ethiopia | 97.2 /100 | #109 | Exceptional 10.5% |
| Koreans | 97.1 /100 | #110 | Exceptional 10.5% |
| Brazilians | 96.9 /100 | #111 | Exceptional 10.5% |
| Assyrians/Chaldeans/Syriacs | 96.8 /100 | #112 | Exceptional 10.5% |
| Tongans | 96.6 /100 | #113 | Exceptional 10.5% |
| Immigrants | Morocco | 96.6 /100 | #114 | Exceptional 10.5% |
| Immigrants | Netherlands | 96.3 /100 | #115 | Exceptional 10.5% |
| Immigrants | Nepal | 95.9 /100 | #116 | Exceptional 10.6% |
| Immigrants | South Eastern Asia | 95.7 /100 | #117 | Exceptional 10.6% |
| Immigrants | Moldova | 95.5 /100 | #118 | Exceptional 10.6% |
| Luxembourgers | 95.5 /100 | #119 | Exceptional 10.6% |
| Vietnamese | 95.4 /100 | #120 | Exceptional 10.6% |
| Romanians | 95.0 /100 | #121 | Exceptional 10.6% |
| Immigrants | Norway | 95.0 /100 | #122 | Exceptional 10.6% |