Finnish vs Immigrants from Caribbean Divorced or Separated
COMPARE
Finnish
Immigrants from Caribbean
Divorced or Separated
Divorced or Separated Comparison
Finns
Immigrants from Caribbean
12.5%
DIVORCED OR SEPARATED
1.8/ 100
METRIC RATING
249th/ 347
METRIC RANK
13.6%
DIVORCED OR SEPARATED
0.0/ 100
METRIC RATING
328th/ 347
METRIC RANK
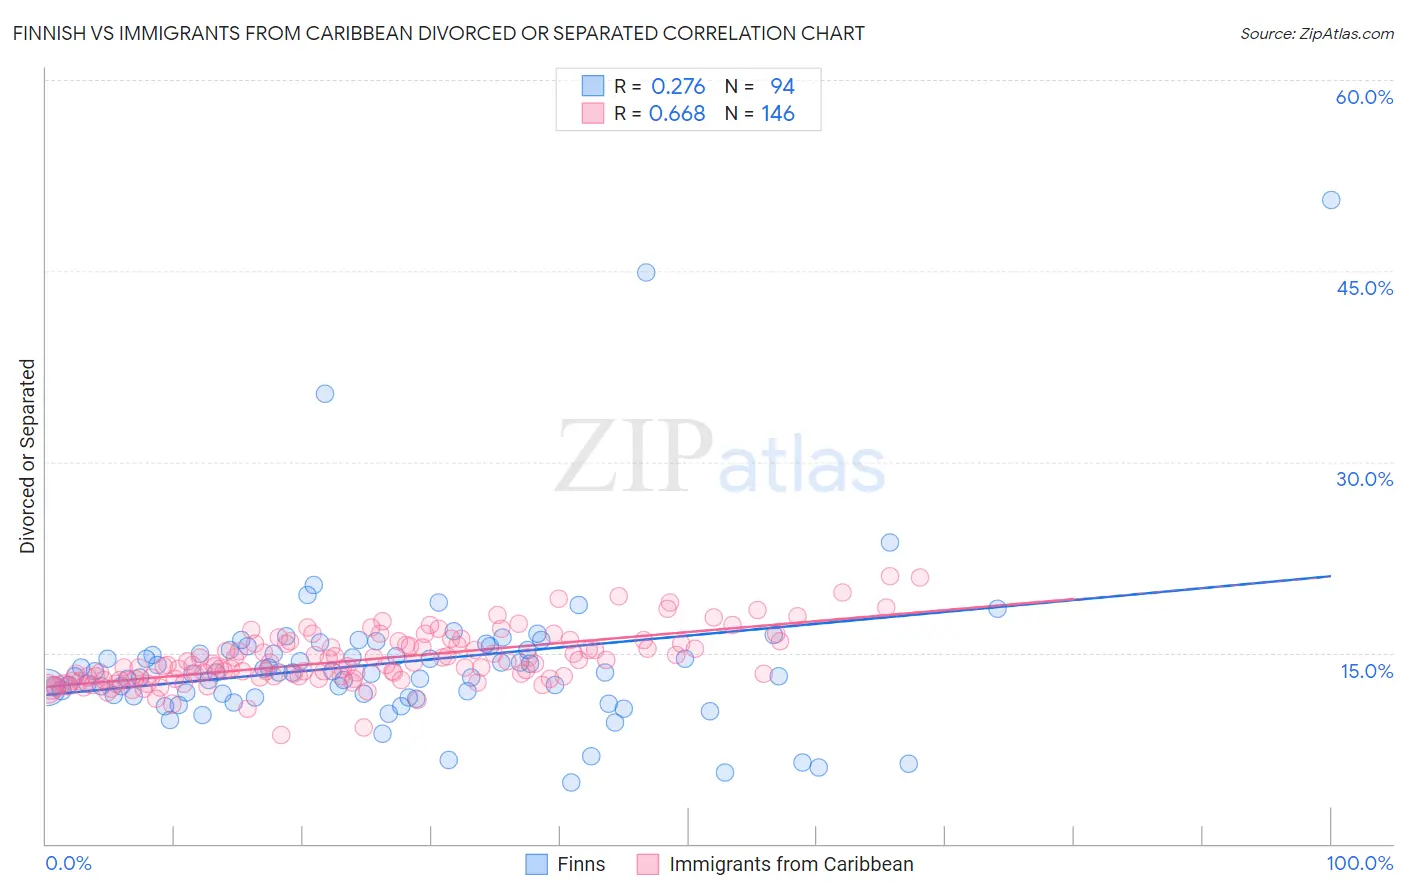
Finnish vs Immigrants from Caribbean Divorced or Separated Correlation Chart
The statistical analysis conducted on geographies consisting of 404,587,172 people shows a weak positive correlation between the proportion of Finns and percentage of population currently divorced or separated in the United States with a correlation coefficient (R) of 0.276 and weighted average of 12.5%. Similarly, the statistical analysis conducted on geographies consisting of 449,832,030 people shows a significant positive correlation between the proportion of Immigrants from Caribbean and percentage of population currently divorced or separated in the United States with a correlation coefficient (R) of 0.668 and weighted average of 13.6%, a difference of 8.8%.
Divorced or Separated Correlation Summary
| Measurement | Finnish | Immigrants from Caribbean |
| Minimum | 4.8% | 8.5% |
| Maximum | 50.5% | 21.0% |
| Range | 45.7% | 12.5% |
| Mean | 14.1% | 14.4% |
| Median | 13.4% | 14.0% |
| Interquartile 25% (IQ1) | 11.7% | 13.0% |
| Interquartile 75% (IQ3) | 15.2% | 15.7% |
| Interquartile Range (IQR) | 3.5% | 2.7% |
| Standard Deviation (Sample) | 6.3% | 2.1% |
| Standard Deviation (Population) | 6.3% | 2.1% |
Similar Demographics by Divorced or Separated
Demographics Similar to Finns by Divorced or Separated
In terms of divorced or separated, the demographic groups most similar to Finns are Nepalese (12.5%, a difference of 0.010%), German (12.5%, a difference of 0.040%), Immigrants from West Indies (12.5%, a difference of 0.070%), Hispanic or Latino (12.5%, a difference of 0.090%), and Irish (12.5%, a difference of 0.27%).
| Demographics | Rating | Rank | Divorced or Separated |
| Dutch | 3.1 /100 | #242 | Tragic 12.4% |
| Immigrants | Latin America | 2.8 /100 | #243 | Tragic 12.4% |
| Alaska Natives | 2.5 /100 | #244 | Tragic 12.4% |
| Hispanics or Latinos | 2.0 /100 | #245 | Tragic 12.5% |
| Immigrants | West Indies | 1.9 /100 | #246 | Tragic 12.5% |
| Germans | 1.8 /100 | #247 | Tragic 12.5% |
| Nepalese | 1.8 /100 | #248 | Tragic 12.5% |
| Finns | 1.8 /100 | #249 | Tragic 12.5% |
| Irish | 1.3 /100 | #250 | Tragic 12.5% |
| Aleuts | 1.3 /100 | #251 | Tragic 12.5% |
| Liberians | 0.9 /100 | #252 | Tragic 12.6% |
| Somalis | 0.9 /100 | #253 | Tragic 12.6% |
| Senegalese | 0.8 /100 | #254 | Tragic 12.6% |
| Welsh | 0.7 /100 | #255 | Tragic 12.6% |
| Immigrants | Colombia | 0.6 /100 | #256 | Tragic 12.6% |
Demographics Similar to Immigrants from Caribbean by Divorced or Separated
In terms of divorced or separated, the demographic groups most similar to Immigrants from Caribbean are Houma (13.6%, a difference of 0.15%), Paiute (13.6%, a difference of 0.26%), Comanche (13.5%, a difference of 0.38%), Black/African American (13.6%, a difference of 0.39%), and Immigrants from Congo (13.5%, a difference of 0.86%).
| Demographics | Rating | Rank | Divorced or Separated |
| Cheyenne | 0.0 /100 | #321 | Tragic 13.4% |
| Immigrants | Haiti | 0.0 /100 | #322 | Tragic 13.4% |
| U.S. Virgin Islanders | 0.0 /100 | #323 | Tragic 13.4% |
| Osage | 0.0 /100 | #324 | Tragic 13.4% |
| Potawatomi | 0.0 /100 | #325 | Tragic 13.5% |
| Immigrants | Congo | 0.0 /100 | #326 | Tragic 13.5% |
| Comanche | 0.0 /100 | #327 | Tragic 13.5% |
| Immigrants | Caribbean | 0.0 /100 | #328 | Tragic 13.6% |
| Houma | 0.0 /100 | #329 | Tragic 13.6% |
| Paiute | 0.0 /100 | #330 | Tragic 13.6% |
| Blacks/African Americans | 0.0 /100 | #331 | Tragic 13.6% |
| Cherokee | 0.0 /100 | #332 | Tragic 13.7% |
| Puerto Ricans | 0.0 /100 | #333 | Tragic 13.9% |
| Immigrants | Bahamas | 0.0 /100 | #334 | Tragic 13.9% |
| Dutch West Indians | 0.0 /100 | #335 | Tragic 14.0% |