Iranian vs Immigrants from France Births to Unmarried Women
COMPARE
Iranian
Immigrants from France
Births to Unmarried Women
Births to Unmarried Women Comparison
Iranians
Immigrants from France
25.3%
BIRTHS TO UNMARRIED WOMEN
100.0/ 100
METRIC RATING
13th/ 347
METRIC RANK
29.0%
BIRTHS TO UNMARRIED WOMEN
97.3/ 100
METRIC RATING
88th/ 347
METRIC RANK
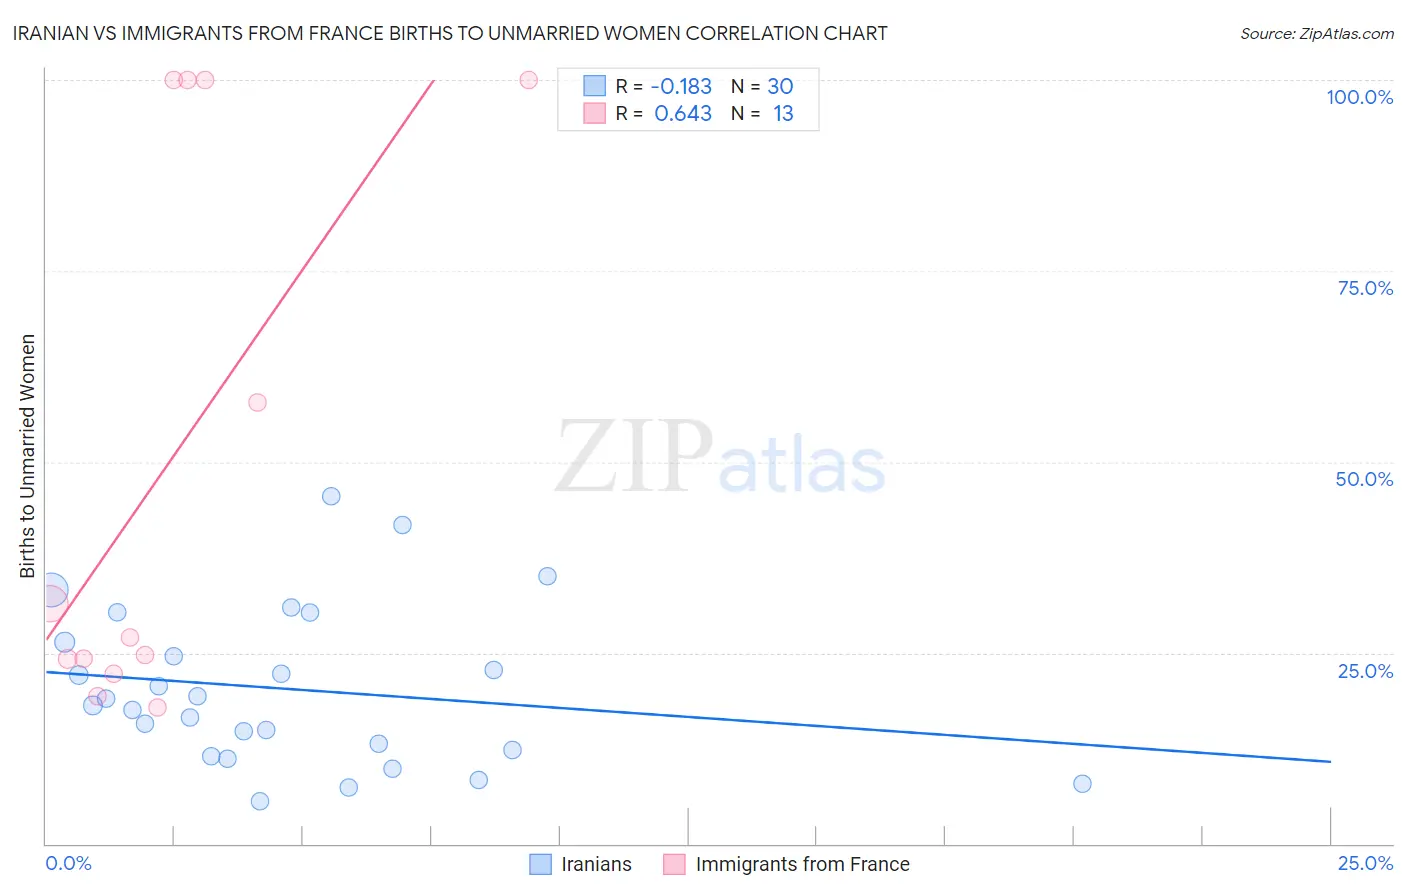
Iranian vs Immigrants from France Births to Unmarried Women Correlation Chart
The statistical analysis conducted on geographies consisting of 297,991,005 people shows a poor negative correlation between the proportion of Iranians and percentage of births to unmarried women in the United States with a correlation coefficient (R) of -0.183 and weighted average of 25.3%. Similarly, the statistical analysis conducted on geographies consisting of 270,306,848 people shows a significant positive correlation between the proportion of Immigrants from France and percentage of births to unmarried women in the United States with a correlation coefficient (R) of 0.643 and weighted average of 29.0%, a difference of 14.6%.
Births to Unmarried Women Correlation Summary
| Measurement | Iranian | Immigrants from France |
| Minimum | 5.5% | 17.9% |
| Maximum | 45.5% | 100.0% |
| Range | 40.0% | 82.1% |
| Mean | 20.3% | 49.9% |
| Median | 18.6% | 26.9% |
| Interquartile 25% (IQ1) | 12.2% | 23.2% |
| Interquartile 75% (IQ3) | 26.4% | 100.0% |
| Interquartile Range (IQR) | 14.2% | 76.8% |
| Standard Deviation (Sample) | 10.2% | 36.1% |
| Standard Deviation (Population) | 10.1% | 34.7% |
Similar Demographics by Births to Unmarried Women
Demographics Similar to Iranians by Births to Unmarried Women
In terms of births to unmarried women, the demographic groups most similar to Iranians are Immigrants from Lebanon (25.3%, a difference of 0.12%), Indian (Asian) (25.3%, a difference of 0.14%), Immigrants from Israel (25.1%, a difference of 0.61%), Immigrants from Eastern Asia (25.0%, a difference of 1.0%), and Immigrants from Singapore (25.6%, a difference of 1.3%).
| Demographics | Rating | Rank | Births to Unmarried Women |
| Immigrants | Iran | 100.0 /100 | #6 | Exceptional 24.0% |
| Thais | 100.0 /100 | #7 | Exceptional 24.0% |
| Immigrants | China | 100.0 /100 | #8 | Exceptional 24.7% |
| Immigrants | South Central Asia | 100.0 /100 | #9 | Exceptional 24.7% |
| Immigrants | Eastern Asia | 100.0 /100 | #10 | Exceptional 25.0% |
| Immigrants | Israel | 100.0 /100 | #11 | Exceptional 25.1% |
| Indians (Asian) | 100.0 /100 | #12 | Exceptional 25.3% |
| Iranians | 100.0 /100 | #13 | Exceptional 25.3% |
| Immigrants | Lebanon | 100.0 /100 | #14 | Exceptional 25.3% |
| Immigrants | Singapore | 100.0 /100 | #15 | Exceptional 25.6% |
| Immigrants | Belarus | 100.0 /100 | #16 | Exceptional 25.6% |
| Immigrants | Uzbekistan | 100.0 /100 | #17 | Exceptional 25.8% |
| Immigrants | Armenia | 99.9 /100 | #18 | Exceptional 26.1% |
| Armenians | 99.9 /100 | #19 | Exceptional 26.2% |
| Immigrants | Korea | 99.9 /100 | #20 | Exceptional 26.3% |
Demographics Similar to Immigrants from France by Births to Unmarried Women
In terms of births to unmarried women, the demographic groups most similar to Immigrants from France are Taiwanese (29.0%, a difference of 0.010%), Immigrants from Jordan (29.0%, a difference of 0.080%), Sri Lankan (28.9%, a difference of 0.16%), Immigrants from Saudi Arabia (29.1%, a difference of 0.28%), and Immigrants from Poland (28.9%, a difference of 0.32%).
| Demographics | Rating | Rank | Births to Unmarried Women |
| Immigrants | Austria | 98.1 /100 | #81 | Exceptional 28.7% |
| Romanians | 98.0 /100 | #82 | Exceptional 28.7% |
| Immigrants | Kuwait | 98.0 /100 | #83 | Exceptional 28.8% |
| Immigrants | Poland | 97.6 /100 | #84 | Exceptional 28.9% |
| Sri Lankans | 97.5 /100 | #85 | Exceptional 28.9% |
| Immigrants | Jordan | 97.4 /100 | #86 | Exceptional 29.0% |
| Taiwanese | 97.3 /100 | #87 | Exceptional 29.0% |
| Immigrants | France | 97.3 /100 | #88 | Exceptional 29.0% |
| Immigrants | Saudi Arabia | 97.0 /100 | #89 | Exceptional 29.1% |
| Immigrants | Latvia | 96.8 /100 | #90 | Exceptional 29.1% |
| Immigrants | Fiji | 96.6 /100 | #91 | Exceptional 29.2% |
| Arabs | 96.5 /100 | #92 | Exceptional 29.2% |
| Estonians | 96.5 /100 | #93 | Exceptional 29.2% |
| Ukrainians | 96.3 /100 | #94 | Exceptional 29.2% |
| Immigrants | Vietnam | 96.1 /100 | #95 | Exceptional 29.3% |