Iranian vs Fijian Births to Unmarried Women
COMPARE
Iranian
Fijian
Births to Unmarried Women
Births to Unmarried Women Comparison
Iranians
Fijians
25.3%
BIRTHS TO UNMARRIED WOMEN
100.0/ 100
METRIC RATING
13th/ 347
METRIC RANK
32.3%
BIRTHS TO UNMARRIED WOMEN
31.1/ 100
METRIC RATING
193rd/ 347
METRIC RANK
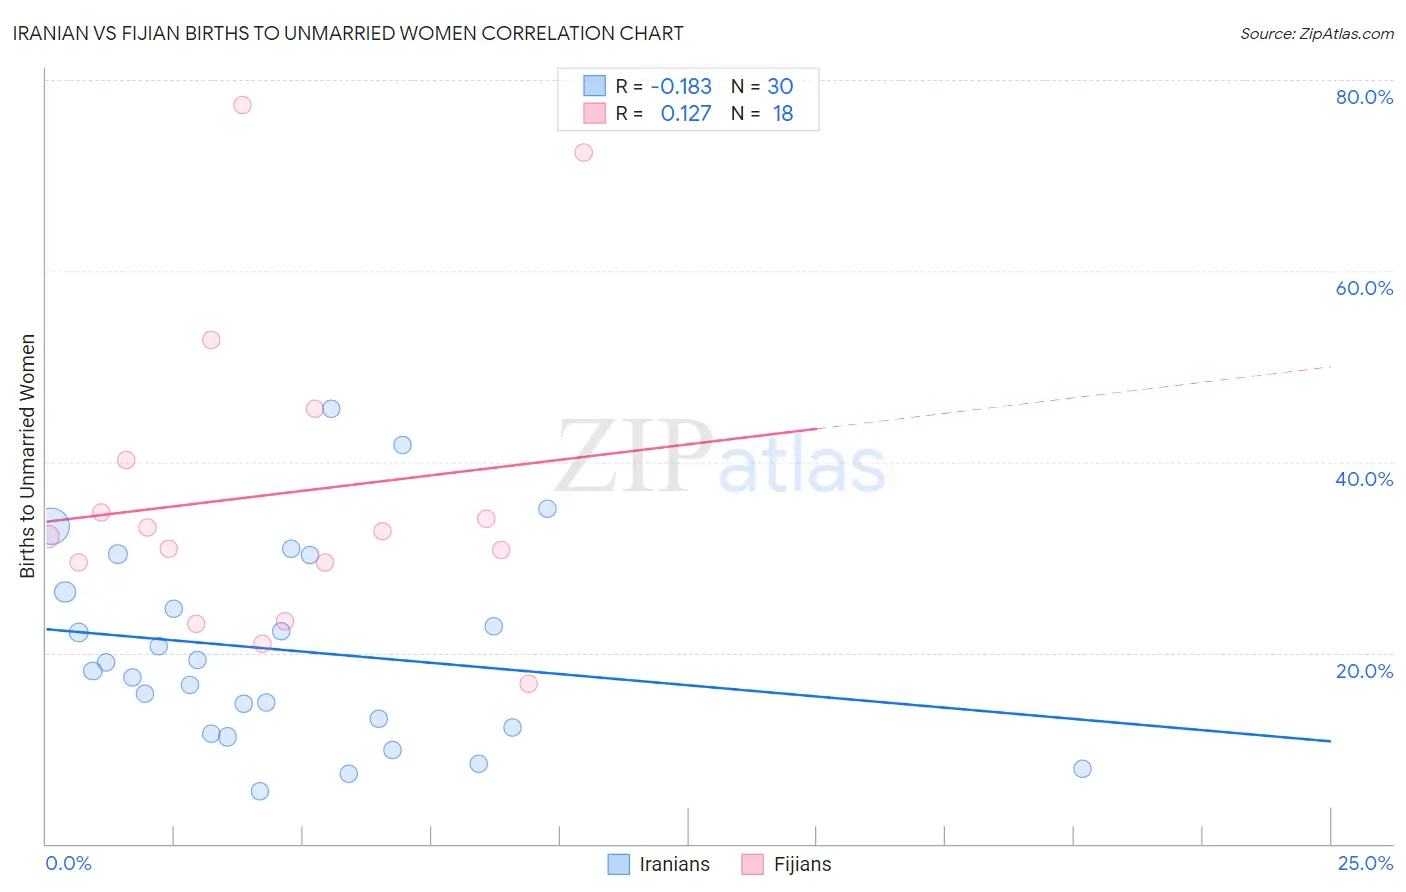
Iranian vs Fijian Births to Unmarried Women Correlation Chart
The statistical analysis conducted on geographies consisting of 297,991,005 people shows a poor negative correlation between the proportion of Iranians and percentage of births to unmarried women in the United States with a correlation coefficient (R) of -0.183 and weighted average of 25.3%. Similarly, the statistical analysis conducted on geographies consisting of 54,941,736 people shows a poor positive correlation between the proportion of Fijians and percentage of births to unmarried women in the United States with a correlation coefficient (R) of 0.127 and weighted average of 32.3%, a difference of 27.5%.
Births to Unmarried Women Correlation Summary
| Measurement | Iranian | Fijian |
| Minimum | 5.5% | 16.7% |
| Maximum | 45.5% | 77.3% |
| Range | 40.0% | 60.6% |
| Mean | 20.3% | 36.6% |
| Median | 18.6% | 32.4% |
| Interquartile 25% (IQ1) | 12.2% | 29.4% |
| Interquartile 75% (IQ3) | 26.4% | 40.3% |
| Interquartile Range (IQR) | 14.2% | 10.9% |
| Standard Deviation (Sample) | 10.2% | 16.3% |
| Standard Deviation (Population) | 10.1% | 15.8% |
Similar Demographics by Births to Unmarried Women
Demographics Similar to Iranians by Births to Unmarried Women
In terms of births to unmarried women, the demographic groups most similar to Iranians are Immigrants from Lebanon (25.3%, a difference of 0.12%), Indian (Asian) (25.3%, a difference of 0.14%), Immigrants from Israel (25.1%, a difference of 0.61%), Immigrants from Eastern Asia (25.0%, a difference of 1.0%), and Immigrants from Singapore (25.6%, a difference of 1.3%).
| Demographics | Rating | Rank | Births to Unmarried Women |
| Immigrants | Iran | 100.0 /100 | #6 | Exceptional 24.0% |
| Thais | 100.0 /100 | #7 | Exceptional 24.0% |
| Immigrants | China | 100.0 /100 | #8 | Exceptional 24.7% |
| Immigrants | South Central Asia | 100.0 /100 | #9 | Exceptional 24.7% |
| Immigrants | Eastern Asia | 100.0 /100 | #10 | Exceptional 25.0% |
| Immigrants | Israel | 100.0 /100 | #11 | Exceptional 25.1% |
| Indians (Asian) | 100.0 /100 | #12 | Exceptional 25.3% |
| Iranians | 100.0 /100 | #13 | Exceptional 25.3% |
| Immigrants | Lebanon | 100.0 /100 | #14 | Exceptional 25.3% |
| Immigrants | Singapore | 100.0 /100 | #15 | Exceptional 25.6% |
| Immigrants | Belarus | 100.0 /100 | #16 | Exceptional 25.6% |
| Immigrants | Uzbekistan | 100.0 /100 | #17 | Exceptional 25.8% |
| Immigrants | Armenia | 99.9 /100 | #18 | Exceptional 26.1% |
| Armenians | 99.9 /100 | #19 | Exceptional 26.2% |
| Immigrants | Korea | 99.9 /100 | #20 | Exceptional 26.3% |
Demographics Similar to Fijians by Births to Unmarried Women
In terms of births to unmarried women, the demographic groups most similar to Fijians are Colombian (32.2%, a difference of 0.090%), Irish (32.2%, a difference of 0.14%), Tlingit-Haida (32.2%, a difference of 0.17%), Sudanese (32.4%, a difference of 0.42%), and Immigrants from Kenya (32.1%, a difference of 0.61%).
| Demographics | Rating | Rank | Births to Unmarried Women |
| Welsh | 38.2 /100 | #186 | Fair 32.0% |
| Czechoslovakians | 38.0 /100 | #187 | Fair 32.0% |
| Osage | 37.1 /100 | #188 | Fair 32.1% |
| Immigrants | Kenya | 36.9 /100 | #189 | Fair 32.1% |
| Tlingit-Haida | 32.6 /100 | #190 | Fair 32.2% |
| Irish | 32.4 /100 | #191 | Fair 32.2% |
| Colombians | 31.9 /100 | #192 | Fair 32.2% |
| Fijians | 31.1 /100 | #193 | Fair 32.3% |
| Sudanese | 27.3 /100 | #194 | Fair 32.4% |
| Samoans | 21.9 /100 | #195 | Fair 32.6% |
| Immigrants | Colombia | 21.7 /100 | #196 | Fair 32.6% |
| Immigrants | Immigrants | 20.6 /100 | #197 | Fair 32.7% |
| Costa Ricans | 20.3 /100 | #198 | Fair 32.7% |
| Immigrants | Thailand | 18.9 /100 | #199 | Poor 32.8% |
| Immigrants | Germany | 18.8 /100 | #200 | Poor 32.8% |