Iranian vs Comanche Per Capita Income
COMPARE
Iranian
Comanche
Per Capita Income
Per Capita Income Comparison
Iranians
Comanche
$58,786
PER CAPITA INCOME
100.0/ 100
METRIC RATING
2nd/ 347
METRIC RANK
$38,088
PER CAPITA INCOME
0.2/ 100
METRIC RATING
277th/ 347
METRIC RANK
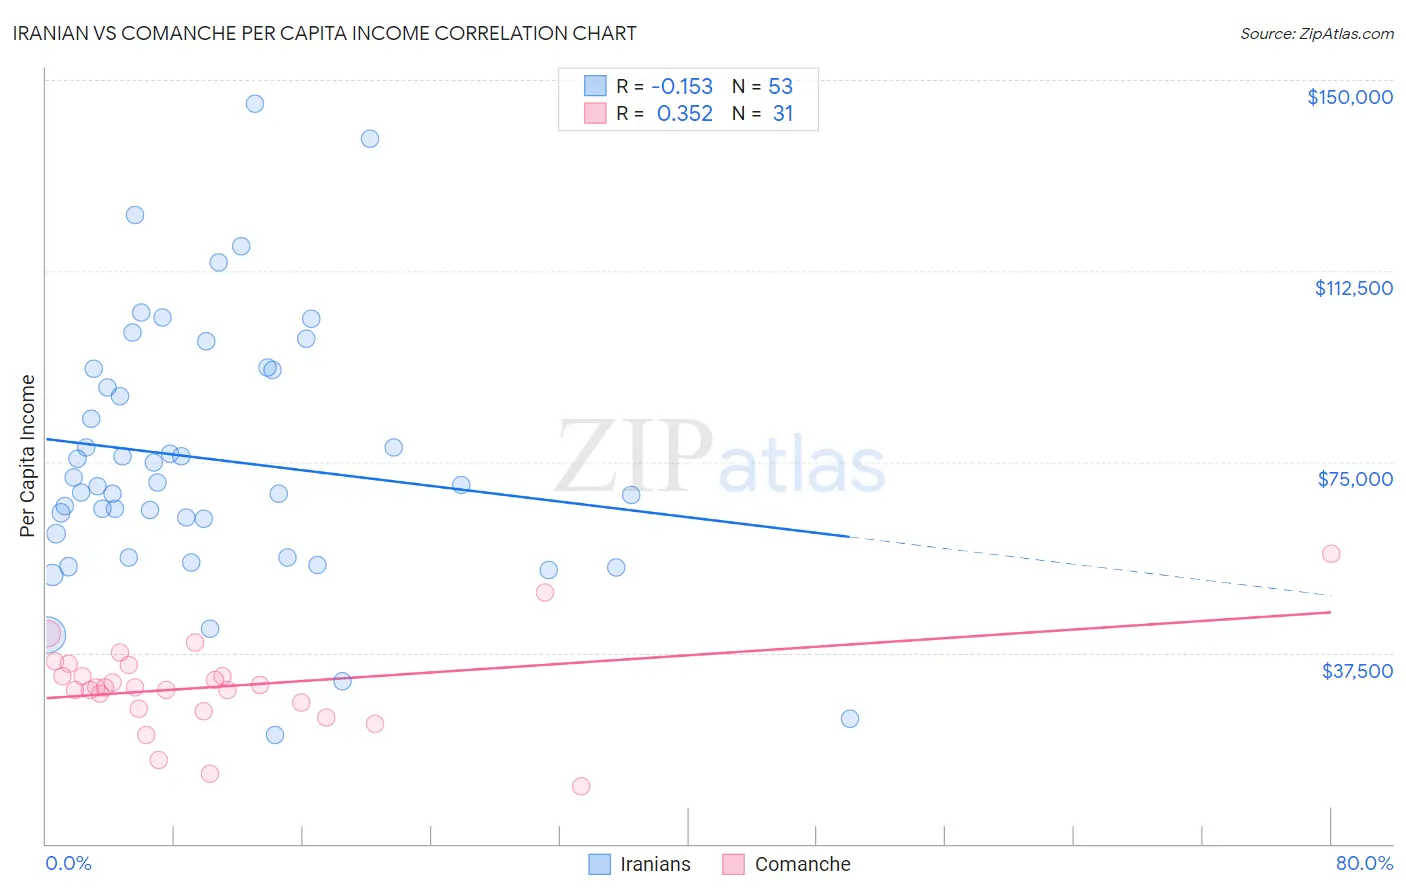
Iranian vs Comanche Per Capita Income Correlation Chart
The statistical analysis conducted on geographies consisting of 316,916,136 people shows a poor negative correlation between the proportion of Iranians and per capita income in the United States with a correlation coefficient (R) of -0.153 and weighted average of $58,786. Similarly, the statistical analysis conducted on geographies consisting of 109,786,530 people shows a mild positive correlation between the proportion of Comanche and per capita income in the United States with a correlation coefficient (R) of 0.352 and weighted average of $38,088, a difference of 54.3%.
Per Capita Income Correlation Summary
| Measurement | Iranian | Comanche |
| Minimum | $21,346 | $11,178 |
| Maximum | $145,312 | $56,980 |
| Range | $123,966 | $45,802 |
| Mean | $75,439 | $30,910 |
| Median | $70,507 | $30,680 |
| Interquartile 25% (IQ1) | $58,523 | $26,547 |
| Interquartile 75% (IQ3) | $93,126 | $35,132 |
| Interquartile Range (IQR) | $34,604 | $8,585 |
| Standard Deviation (Sample) | $25,681 | $9,053 |
| Standard Deviation (Population) | $25,438 | $8,906 |
Similar Demographics by Per Capita Income
Demographics Similar to Iranians by Per Capita Income
In terms of per capita income, the demographic groups most similar to Iranians are Filipino ($59,066, a difference of 0.48%), Immigrants from Singapore ($58,353, a difference of 0.74%), Immigrants from Australia ($57,953, a difference of 1.4%), Immigrants from Iran ($57,759, a difference of 1.8%), and Immigrants from Taiwan ($57,742, a difference of 1.8%).
| Demographics | Rating | Rank | Per Capita Income |
| Filipinos | 100.0 /100 | #1 | Exceptional $59,066 |
| Iranians | 100.0 /100 | #2 | Exceptional $58,786 |
| Immigrants | Singapore | 100.0 /100 | #3 | Exceptional $58,353 |
| Immigrants | Australia | 100.0 /100 | #4 | Exceptional $57,953 |
| Immigrants | Iran | 100.0 /100 | #5 | Exceptional $57,759 |
| Immigrants | Taiwan | 100.0 /100 | #6 | Exceptional $57,742 |
| Immigrants | Israel | 100.0 /100 | #7 | Exceptional $57,384 |
| Immigrants | Hong Kong | 100.0 /100 | #8 | Exceptional $56,709 |
| Immigrants | Ireland | 100.0 /100 | #9 | Exceptional $56,584 |
| Okinawans | 100.0 /100 | #10 | Exceptional $55,817 |
| Eastern Europeans | 100.0 /100 | #11 | Exceptional $55,780 |
| Immigrants | Sweden | 100.0 /100 | #12 | Exceptional $55,582 |
| Immigrants | India | 100.0 /100 | #13 | Exceptional $55,268 |
| Immigrants | Belgium | 100.0 /100 | #14 | Exceptional $55,082 |
| Cypriots | 100.0 /100 | #15 | Exceptional $54,899 |
Demographics Similar to Comanche by Per Capita Income
In terms of per capita income, the demographic groups most similar to Comanche are Immigrants from Nicaragua ($38,065, a difference of 0.060%), Hmong ($38,120, a difference of 0.080%), Colville ($38,047, a difference of 0.11%), Potawatomi ($38,046, a difference of 0.11%), and Immigrants from Liberia ($38,165, a difference of 0.20%).
| Demographics | Rating | Rank | Per Capita Income |
| Immigrants | Belize | 0.3 /100 | #270 | Tragic $38,614 |
| Central Americans | 0.3 /100 | #271 | Tragic $38,560 |
| Immigrants | Cabo Verde | 0.3 /100 | #272 | Tragic $38,540 |
| Nepalese | 0.3 /100 | #273 | Tragic $38,442 |
| Immigrants | El Salvador | 0.3 /100 | #274 | Tragic $38,394 |
| Immigrants | Liberia | 0.2 /100 | #275 | Tragic $38,165 |
| Hmong | 0.2 /100 | #276 | Tragic $38,120 |
| Comanche | 0.2 /100 | #277 | Tragic $38,088 |
| Immigrants | Nicaragua | 0.2 /100 | #278 | Tragic $38,065 |
| Colville | 0.2 /100 | #279 | Tragic $38,047 |
| Potawatomi | 0.2 /100 | #280 | Tragic $38,046 |
| Immigrants | Dominica | 0.2 /100 | #281 | Tragic $37,952 |
| Immigrants | Laos | 0.1 /100 | #282 | Tragic $37,857 |
| Pennsylvania Germans | 0.1 /100 | #283 | Tragic $37,842 |
| Africans | 0.1 /100 | #284 | Tragic $37,785 |