Iranian vs Burmese Births to Unmarried Women
COMPARE
Iranian
Burmese
Births to Unmarried Women
Births to Unmarried Women Comparison
Iranians
Burmese
25.3%
BIRTHS TO UNMARRIED WOMEN
100.0/ 100
METRIC RATING
13th/ 347
METRIC RANK
26.4%
BIRTHS TO UNMARRIED WOMEN
99.9/ 100
METRIC RATING
22nd/ 347
METRIC RANK
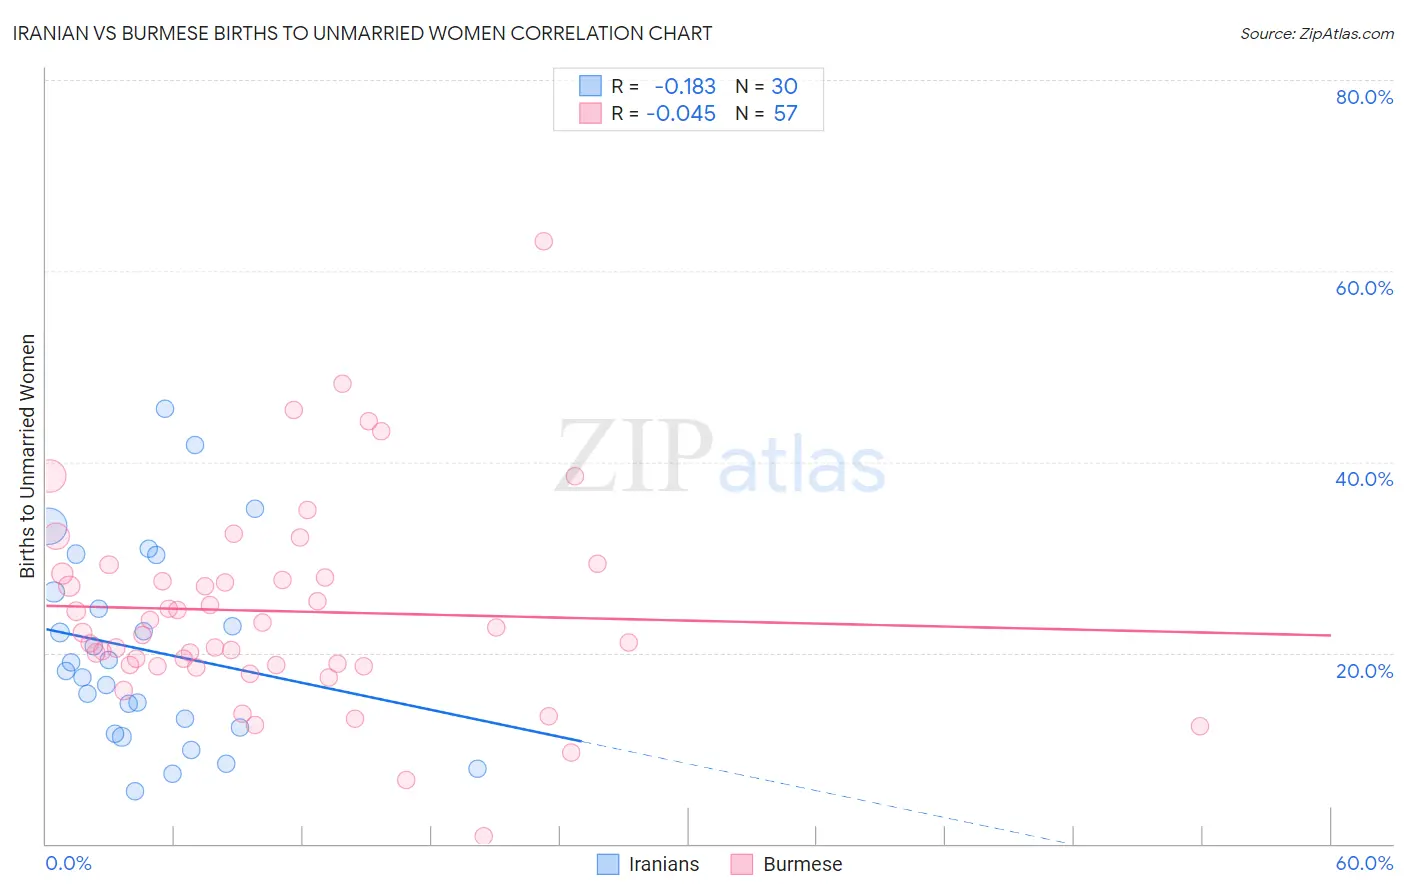
Iranian vs Burmese Births to Unmarried Women Correlation Chart
The statistical analysis conducted on geographies consisting of 297,991,005 people shows a poor negative correlation between the proportion of Iranians and percentage of births to unmarried women in the United States with a correlation coefficient (R) of -0.183 and weighted average of 25.3%. Similarly, the statistical analysis conducted on geographies consisting of 428,519,429 people shows no correlation between the proportion of Burmese and percentage of births to unmarried women in the United States with a correlation coefficient (R) of -0.045 and weighted average of 26.4%, a difference of 4.2%.
Births to Unmarried Women Correlation Summary
| Measurement | Iranian | Burmese |
| Minimum | 5.5% | 0.80% |
| Maximum | 45.5% | 63.1% |
| Range | 40.0% | 62.3% |
| Mean | 20.3% | 24.4% |
| Median | 18.6% | 22.1% |
| Interquartile 25% (IQ1) | 12.2% | 18.7% |
| Interquartile 75% (IQ3) | 26.4% | 28.1% |
| Interquartile Range (IQR) | 14.2% | 9.4% |
| Standard Deviation (Sample) | 10.2% | 10.7% |
| Standard Deviation (Population) | 10.1% | 10.6% |
Demographics Similar to Iranians and Burmese by Births to Unmarried Women
In terms of births to unmarried women, the demographic groups most similar to Iranians are Immigrants from Lebanon (25.3%, a difference of 0.12%), Indian (Asian) (25.3%, a difference of 0.14%), Immigrants from Israel (25.1%, a difference of 0.61%), Immigrants from Eastern Asia (25.0%, a difference of 1.0%), and Immigrants from Singapore (25.6%, a difference of 1.3%). Similarly, the demographic groups most similar to Burmese are Immigrants from Japan (26.4%, a difference of 0.19%), Soviet Union (26.3%, a difference of 0.22%), Immigrants from Korea (26.3%, a difference of 0.36%), Armenian (26.2%, a difference of 0.57%), and Immigrants from Australia (26.6%, a difference of 0.98%).
| Demographics | Rating | Rank | Births to Unmarried Women |
| Thais | 100.0 /100 | #7 | Exceptional 24.0% |
| Immigrants | China | 100.0 /100 | #8 | Exceptional 24.7% |
| Immigrants | South Central Asia | 100.0 /100 | #9 | Exceptional 24.7% |
| Immigrants | Eastern Asia | 100.0 /100 | #10 | Exceptional 25.0% |
| Immigrants | Israel | 100.0 /100 | #11 | Exceptional 25.1% |
| Indians (Asian) | 100.0 /100 | #12 | Exceptional 25.3% |
| Iranians | 100.0 /100 | #13 | Exceptional 25.3% |
| Immigrants | Lebanon | 100.0 /100 | #14 | Exceptional 25.3% |
| Immigrants | Singapore | 100.0 /100 | #15 | Exceptional 25.6% |
| Immigrants | Belarus | 100.0 /100 | #16 | Exceptional 25.6% |
| Immigrants | Uzbekistan | 100.0 /100 | #17 | Exceptional 25.8% |
| Immigrants | Armenia | 99.9 /100 | #18 | Exceptional 26.1% |
| Armenians | 99.9 /100 | #19 | Exceptional 26.2% |
| Immigrants | Korea | 99.9 /100 | #20 | Exceptional 26.3% |
| Soviet Union | 99.9 /100 | #21 | Exceptional 26.3% |
| Burmese | 99.9 /100 | #22 | Exceptional 26.4% |
| Immigrants | Japan | 99.9 /100 | #23 | Exceptional 26.4% |
| Immigrants | Australia | 99.9 /100 | #24 | Exceptional 26.6% |
| Cambodians | 99.9 /100 | #25 | Exceptional 26.7% |
| Asians | 99.9 /100 | #26 | Exceptional 26.8% |
| Immigrants | Asia | 99.9 /100 | #27 | Exceptional 26.8% |