Iranian vs Central American Indian Average Family Size
COMPARE
Iranian
Central American Indian
Average Family Size
Average Family Size Comparison
Iranians
Central American Indians
3.18
AVERAGE FAMILY SIZE
4.5/ 100
METRIC RATING
234th/ 347
METRIC RANK
3.35
AVERAGE FAMILY SIZE
100.0/ 100
METRIC RATING
61st/ 347
METRIC RANK
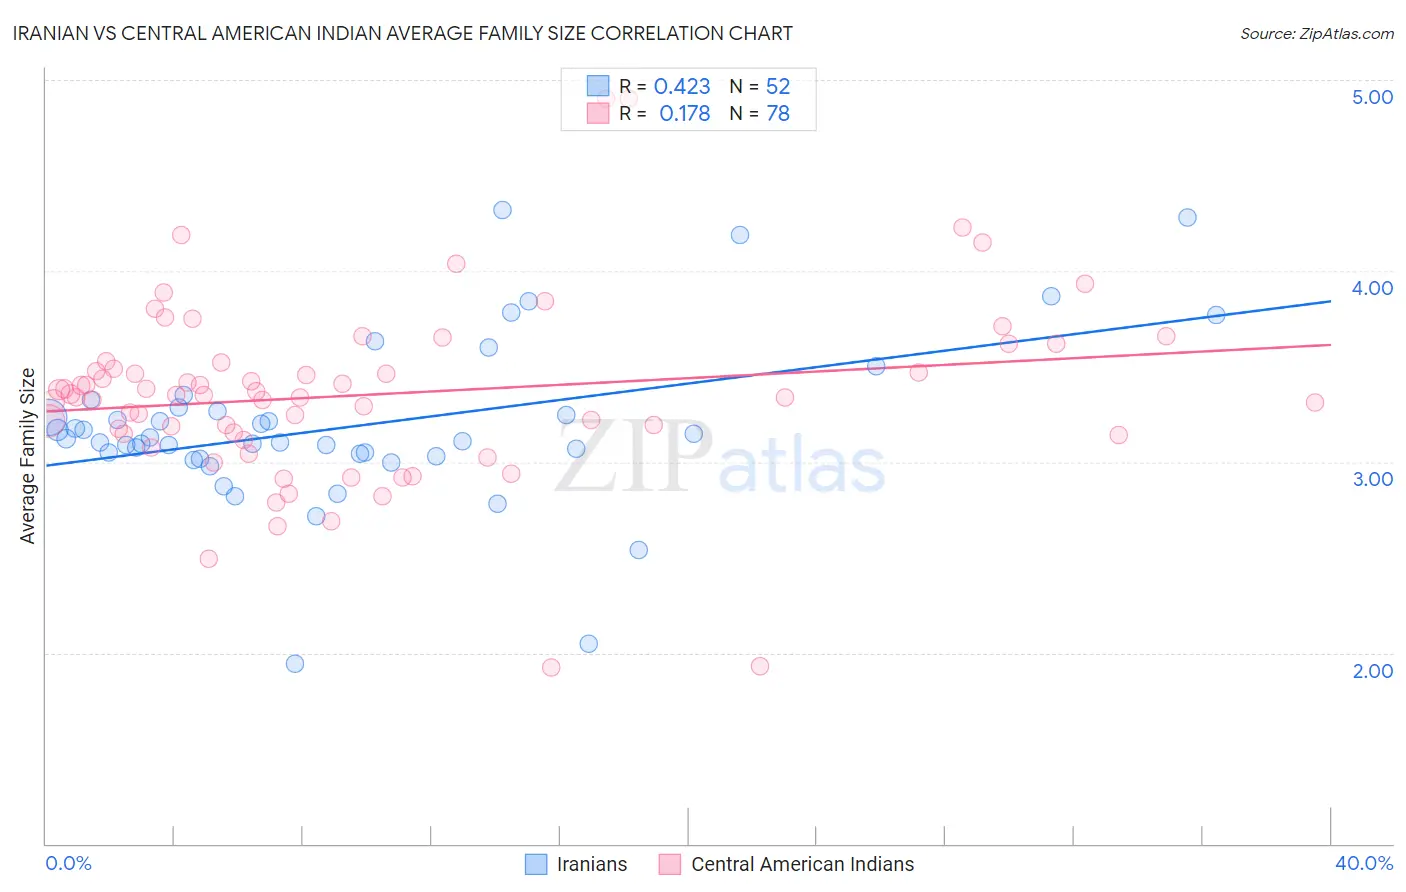
Iranian vs Central American Indian Average Family Size Correlation Chart
The statistical analysis conducted on geographies consisting of 316,654,945 people shows a moderate positive correlation between the proportion of Iranians and average family size in the United States with a correlation coefficient (R) of 0.423 and weighted average of 3.18. Similarly, the statistical analysis conducted on geographies consisting of 326,061,161 people shows a poor positive correlation between the proportion of Central American Indians and average family size in the United States with a correlation coefficient (R) of 0.178 and weighted average of 3.35, a difference of 5.1%.
Average Family Size Correlation Summary
| Measurement | Iranian | Central American Indian |
| Minimum | 1.94 | 1.92 |
| Maximum | 4.32 | 4.90 |
| Range | 2.38 | 2.98 |
| Mean | 3.19 | 3.35 |
| Median | 3.12 | 3.35 |
| Interquartile 25% (IQ1) | 3.04 | 3.15 |
| Interquartile 75% (IQ3) | 3.27 | 3.52 |
| Interquartile Range (IQR) | 0.24 | 0.37 |
| Standard Deviation (Sample) | 0.44 | 0.48 |
| Standard Deviation (Population) | 0.44 | 0.48 |
Similar Demographics by Average Family Size
Demographics Similar to Iranians by Average Family Size
In terms of average family size, the demographic groups most similar to Iranians are Brazilian (3.18, a difference of 0.0%), Immigrants from Turkey (3.18, a difference of 0.020%), Cherokee (3.18, a difference of 0.030%), Immigrants from Portugal (3.18, a difference of 0.030%), and Icelander (3.19, a difference of 0.070%).
| Demographics | Rating | Rank | Average Family Size |
| Portuguese | 6.0 /100 | #227 | Tragic 3.19 |
| Immigrants | Nonimmigrants | 5.7 /100 | #228 | Tragic 3.19 |
| Immigrants | Italy | 5.3 /100 | #229 | Tragic 3.19 |
| Icelanders | 5.2 /100 | #230 | Tragic 3.19 |
| Basques | 5.2 /100 | #231 | Tragic 3.19 |
| Cherokee | 4.7 /100 | #232 | Tragic 3.18 |
| Brazilians | 4.5 /100 | #233 | Tragic 3.18 |
| Iranians | 4.5 /100 | #234 | Tragic 3.18 |
| Immigrants | Turkey | 4.2 /100 | #235 | Tragic 3.18 |
| Immigrants | Portugal | 4.2 /100 | #236 | Tragic 3.18 |
| Immigrants | Romania | 3.7 /100 | #237 | Tragic 3.18 |
| Romanians | 3.7 /100 | #238 | Tragic 3.18 |
| Houma | 3.4 /100 | #239 | Tragic 3.18 |
| Osage | 3.2 /100 | #240 | Tragic 3.18 |
| Immigrants | Japan | 3.0 /100 | #241 | Tragic 3.18 |
Demographics Similar to Central American Indians by Average Family Size
In terms of average family size, the demographic groups most similar to Central American Indians are Immigrants from Armenia (3.35, a difference of 0.030%), Japanese (3.35, a difference of 0.050%), Honduran (3.35, a difference of 0.14%), Sri Lankan (3.35, a difference of 0.15%), and Immigrants from Grenada (3.34, a difference of 0.19%).
| Demographics | Rating | Rank | Average Family Size |
| Immigrants | South Eastern Asia | 100.0 /100 | #54 | Exceptional 3.36 |
| Immigrants | Honduras | 100.0 /100 | #55 | Exceptional 3.36 |
| Immigrants | Dominican Republic | 100.0 /100 | #56 | Exceptional 3.35 |
| Sri Lankans | 100.0 /100 | #57 | Exceptional 3.35 |
| Hondurans | 100.0 /100 | #58 | Exceptional 3.35 |
| Japanese | 100.0 /100 | #59 | Exceptional 3.35 |
| Immigrants | Armenia | 100.0 /100 | #60 | Exceptional 3.35 |
| Central American Indians | 100.0 /100 | #61 | Exceptional 3.35 |
| Immigrants | Grenada | 100.0 /100 | #62 | Exceptional 3.34 |
| Chinese | 100.0 /100 | #63 | Exceptional 3.34 |
| Dominicans | 99.9 /100 | #64 | Exceptional 3.34 |
| Immigrants | Laos | 99.9 /100 | #65 | Exceptional 3.34 |
| Immigrants | St. Vincent and the Grenadines | 99.9 /100 | #66 | Exceptional 3.34 |
| Immigrants | Jamaica | 99.9 /100 | #67 | Exceptional 3.33 |
| Immigrants | Cambodia | 99.9 /100 | #68 | Exceptional 3.33 |