Cajun vs Central American Indian Average Family Size
COMPARE
Cajun
Central American Indian
Average Family Size
Average Family Size Comparison
Cajuns
Central American Indians
3.17
AVERAGE FAMILY SIZE
2.4/ 100
METRIC RATING
247th/ 347
METRIC RANK
3.35
AVERAGE FAMILY SIZE
100.0/ 100
METRIC RATING
61st/ 347
METRIC RANK
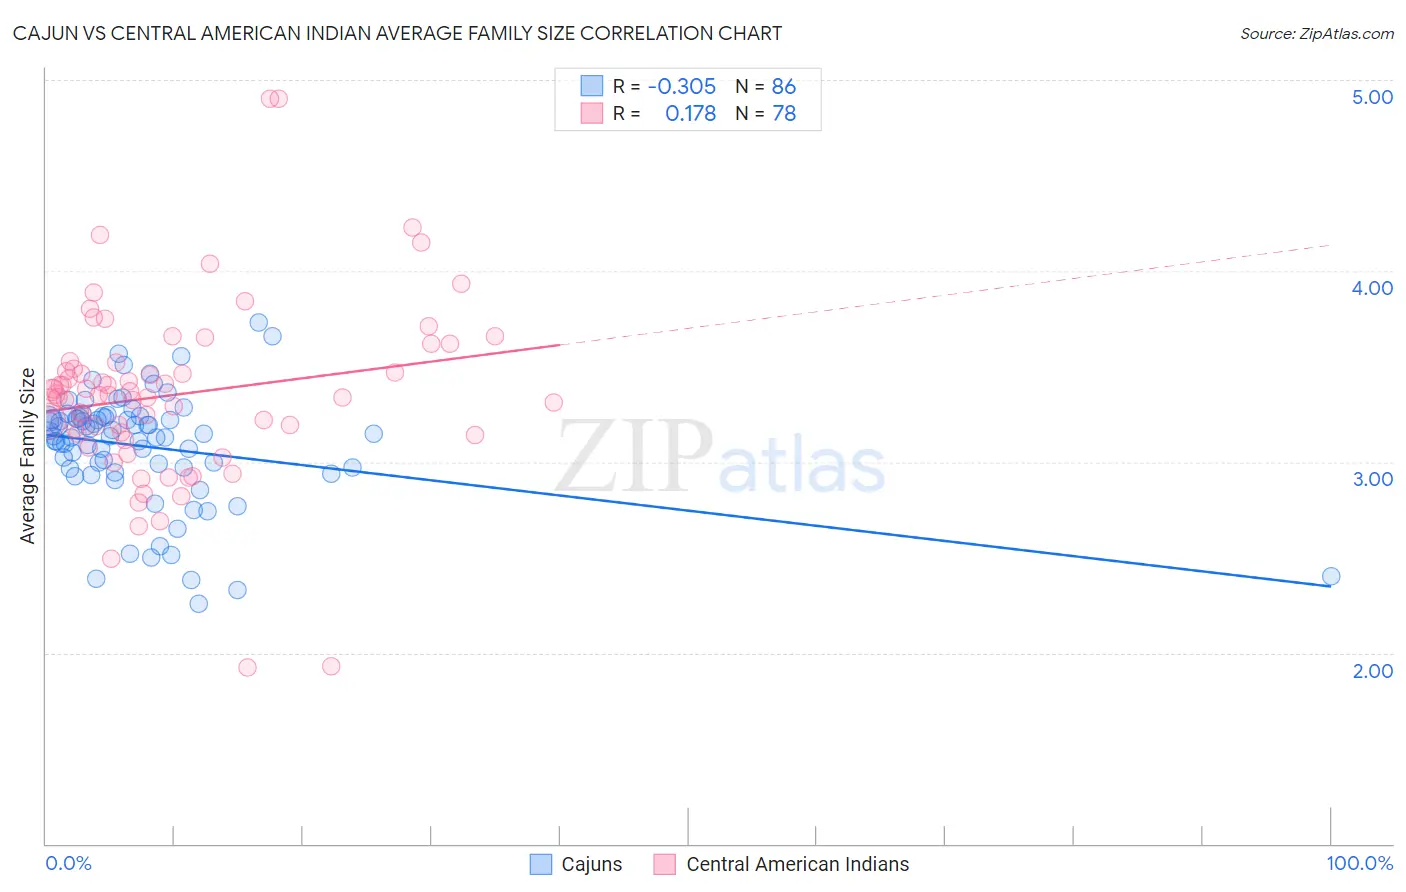
Cajun vs Central American Indian Average Family Size Correlation Chart
The statistical analysis conducted on geographies consisting of 149,695,466 people shows a mild negative correlation between the proportion of Cajuns and average family size in the United States with a correlation coefficient (R) of -0.305 and weighted average of 3.17. Similarly, the statistical analysis conducted on geographies consisting of 326,061,161 people shows a poor positive correlation between the proportion of Central American Indians and average family size in the United States with a correlation coefficient (R) of 0.178 and weighted average of 3.35, a difference of 5.4%.
Average Family Size Correlation Summary
| Measurement | Cajun | Central American Indian |
| Minimum | 2.26 | 1.92 |
| Maximum | 3.73 | 4.90 |
| Range | 1.47 | 2.98 |
| Mean | 3.08 | 3.35 |
| Median | 3.14 | 3.35 |
| Interquartile 25% (IQ1) | 2.97 | 3.15 |
| Interquartile 75% (IQ3) | 3.23 | 3.52 |
| Interquartile Range (IQR) | 0.26 | 0.37 |
| Standard Deviation (Sample) | 0.30 | 0.48 |
| Standard Deviation (Population) | 0.29 | 0.48 |
Similar Demographics by Average Family Size
Demographics Similar to Cajuns by Average Family Size
In terms of average family size, the demographic groups most similar to Cajuns are Danish (3.17, a difference of 0.010%), Immigrants from Belarus (3.17, a difference of 0.030%), Immigrants from Brazil (3.18, a difference of 0.050%), Immigrants from Eastern Europe (3.17, a difference of 0.070%), and Immigrants from Southern Europe (3.18, a difference of 0.080%).
| Demographics | Rating | Rank | Average Family Size |
| Osage | 3.2 /100 | #240 | Tragic 3.18 |
| Immigrants | Japan | 3.0 /100 | #241 | Tragic 3.18 |
| Hungarians | 3.0 /100 | #242 | Tragic 3.18 |
| Immigrants | Moldova | 2.9 /100 | #243 | Tragic 3.18 |
| Immigrants | Southern Europe | 2.9 /100 | #244 | Tragic 3.18 |
| Immigrants | Brazil | 2.7 /100 | #245 | Tragic 3.18 |
| Danes | 2.5 /100 | #246 | Tragic 3.17 |
| Cajuns | 2.4 /100 | #247 | Tragic 3.17 |
| Immigrants | Belarus | 2.3 /100 | #248 | Tragic 3.17 |
| Immigrants | Eastern Europe | 2.1 /100 | #249 | Tragic 3.17 |
| Puget Sound Salish | 1.9 /100 | #250 | Tragic 3.17 |
| Immigrants | Spain | 1.8 /100 | #251 | Tragic 3.17 |
| Immigrants | Saudi Arabia | 1.7 /100 | #252 | Tragic 3.17 |
| South Africans | 1.7 /100 | #253 | Tragic 3.17 |
| Immigrants | Hungary | 1.7 /100 | #254 | Tragic 3.17 |
Demographics Similar to Central American Indians by Average Family Size
In terms of average family size, the demographic groups most similar to Central American Indians are Immigrants from Armenia (3.35, a difference of 0.030%), Japanese (3.35, a difference of 0.050%), Honduran (3.35, a difference of 0.14%), Sri Lankan (3.35, a difference of 0.15%), and Immigrants from Grenada (3.34, a difference of 0.19%).
| Demographics | Rating | Rank | Average Family Size |
| Immigrants | South Eastern Asia | 100.0 /100 | #54 | Exceptional 3.36 |
| Immigrants | Honduras | 100.0 /100 | #55 | Exceptional 3.36 |
| Immigrants | Dominican Republic | 100.0 /100 | #56 | Exceptional 3.35 |
| Sri Lankans | 100.0 /100 | #57 | Exceptional 3.35 |
| Hondurans | 100.0 /100 | #58 | Exceptional 3.35 |
| Japanese | 100.0 /100 | #59 | Exceptional 3.35 |
| Immigrants | Armenia | 100.0 /100 | #60 | Exceptional 3.35 |
| Central American Indians | 100.0 /100 | #61 | Exceptional 3.35 |
| Immigrants | Grenada | 100.0 /100 | #62 | Exceptional 3.34 |
| Chinese | 100.0 /100 | #63 | Exceptional 3.34 |
| Dominicans | 99.9 /100 | #64 | Exceptional 3.34 |
| Immigrants | Laos | 99.9 /100 | #65 | Exceptional 3.34 |
| Immigrants | St. Vincent and the Grenadines | 99.9 /100 | #66 | Exceptional 3.34 |
| Immigrants | Jamaica | 99.9 /100 | #67 | Exceptional 3.33 |
| Immigrants | Cambodia | 99.9 /100 | #68 | Exceptional 3.33 |